


Have you ever needed to create a forecast report in Microsoft® Excel®? How did you calculate the projections? Whichever methods you used, Microsoft has made this much simpler with a new feature called Forecast Sheet. All you need to do is provide the input, and with a single click of the new Forecast Sheet button, Excel […]
- Solutions
All Solutions
- Standalone Reporting Tool
- Sage Intelligence for Accounting
- Sage 300cloud Intelligence
- Sage 50cloud Pastel Intelligence Reporting
- Sage Pastel Payroll Intelligence Reporting
- Sage 100/200 Evolution Intelligence Reporting
- Sage 100 Intelligence Reporting
- Sage 300 Intelligence Reporting
- Sage 500 Intelligence Reporting
- Sage VIP Intelligence Reporting
- Resources
All Solutions
- Standalone Reporting Tool
- Sage Intelligence for Accounting
- Sage 300cloud Intelligence
- Sage 50cloud Pastel Intelligence Reporting
- Sage Pastel Payroll Intelligence Reporting
- Sage 100/200 Evolution Intelligence Reporting
- Sage 100 Intelligence Reporting
- Sage 300 Intelligence Reporting
- Sage 500 Intelligence Reporting
- Sage VIP Intelligence Reporting
Additional Reports
Download our latest Report Utility tool, giving you the ability to access a library of continually updated reports. You don’t need to waste time manually importing new reports, they are automatically imported into the Report Manager module for you to start using.Sage Intelligence Tips & Tricks
Our Sage Intelligence Tips and Tricks will help you make the most of your favorite reporting solution.Excel Tips & Tricks
Our Excel Tips and Tricks will help you improve your business reporting knowledge and skills.
How to automatically open a frequently used workbook

If you start each day needing to use a frequently used workbook, e.g. daily sales report, to-do list, calendar, etc, then this tip is for you. You can automatically open these workbooks, by simply adding the workbooks or a shortcut in the XLStart folder. This is a specific folder that Microsoft® Excel® uses in which files […]
How to extract the formula text in Excel
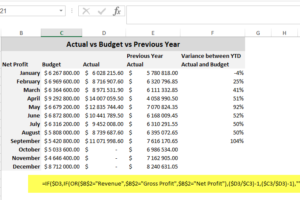
Auditing and troubleshooting formulas in Microsoft® Excel® can be time consuming and difficult. That is why the FORMULATEXT function is helpful because it simplifies formulae error checking and correction. The formula text can easily be extracted without having to copy and paste. The FORMULATEXT function syntax has one required input—a reference to a cell or […]
Learn how to report on more than just your financials in the Financial Report Designer
The Sage Intelligence Financial Report Designer report provides a comprehensive tool for your financial reporting needs. However, there may be times when you’d like to include other data in it to add to the information you can report on in a single report. Although the Report Designer has a defined structure which must be maintained, […]
How to prevent slicers from ruining filtered charts in Excel
Charts are used for creating a graphical presentation of the data. A common practice when creating charts is to create them off of a filtered Pivot Table, usually a Top 5 or a Top 10 Pivot Table. Slicers can then be added to interactively filter the data in the chart. When filtering data with the […]
How to quickly rearrange your worksheets in alphabetical order
Are you looking for a shortcut to quickly rearrange your worksheets in alphabetical order? Instead of dragging and manually arranging your worksheets, you can use VB for Microsoft® Excel® to quickly rearrange them into alphabetical order. Excel currently has no built-in function to rearrange your worksheets. Therefore, if you have a workbook with many worksheets, […]
How to create a Tree Map chart in Excel 2016
The Tree Map chart is a new chart type available in Microsoft® Excel® 2016. It’s used to proportionally display hierarchical levels of data in the form of different sized rectangle blocks. A sales manager can use the Tree Map chart to monitor the performance of the sales consultants. This chart would be best suited to […]
Learn how to categorize debtors balances in Excel using icon sets
As an accountant, you can easily categorize debtors balances by using the conditional formatting – icon sets option. Icon sets creates a visual effect in your data and helps you to see how the value of a cell compares to other cells. In the example below we categorize the debtors balances as follows: red icon […]
Now anyone can master the art of using Excel for business reporting
Is Microsoft® Excel® a major part of your everyday job? Would you like to hone your skills and finally master the art of using Excel like a pro? The Excel On Steroids (EOS) 2013 course may be the solution you’ve been looking for to take your business reporting skills up a notch. Am I invited? […]
Using a bar chart in Excel to display YTD receipts and payments
Using the correct medium to display your financial results is important. As an accountant, you may want to display the YTD receipts and payments on a chart. For example, selecting a pie chart will not be useful as too many values will be displayed; making your data visualization difficult to interpret. In this week’s tip […]
 © Sage South Africa Pty Ltd 2020
.
All Rights Reserved.
© Sage South Africa Pty Ltd 2020
.
All Rights Reserved.