Have you ever needed to create a forecast report in Microsoft® Excel®? How did you calculate the projections? Whichever methods you used, Microsoft has made this much simpler with a new feature called Forecast Sheet.
All you need to do is provide the input, and with a single click of the new Forecast Sheet button, Excel creates a forecast worksheet for you. The new worksheet includes a table of historical and predicted data, and a chart giving you a visual representation of this.
In this tip, we demonstrate how you can use the new Forecast Sheet feature to create a forecast report.
You are welcome to download the workbook to practice.
Applies To: Microsoft® Excel® 2016.
1. Select cell A1.
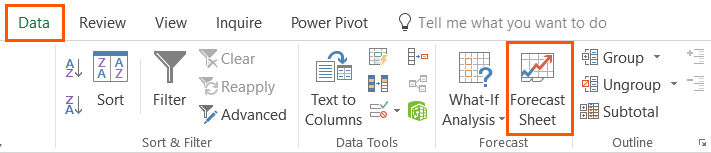
2. Select the Data Tab, then Forecast Sheet.
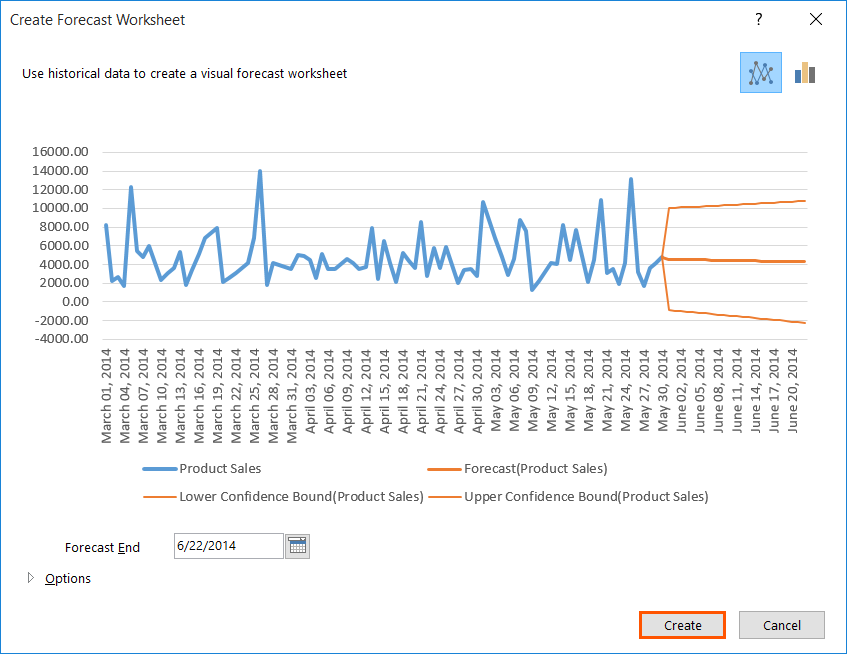
3. Select Create.
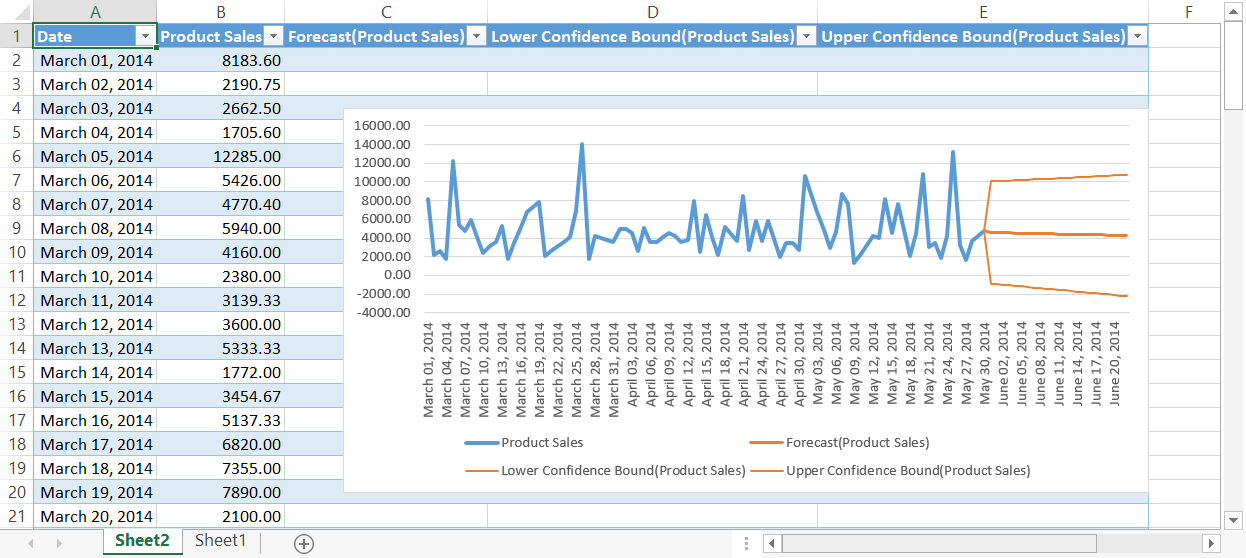
As you can see, a new worksheet has been created showing the table and chart of projections. You can also customize your forecast report even further by setting confidence levels, sensitivity levels, and seasonality to name a few.