When an object has been placed in the same row as your data and you delete some of your rows, you may find that your object will either be compressed or deleted completely. This can easily be avoided by changing a setting in your object properties, thus preventing your object from distorting in Excel. In […]
- Solutions
All Solutions
- Standalone Reporting Tool
- Sage Intelligence for Accounting
- Sage 300cloud Intelligence
- Sage 50cloud Pastel Intelligence Reporting
- Sage Pastel Payroll Intelligence Reporting
- Sage 100/200 Evolution Intelligence Reporting
- Sage 100 Intelligence Reporting
- Sage 300 Intelligence Reporting
- Sage 500 Intelligence Reporting
- Sage VIP Intelligence Reporting
- Resources
All Solutions
- Standalone Reporting Tool
- Sage Intelligence for Accounting
- Sage 300cloud Intelligence
- Sage 50cloud Pastel Intelligence Reporting
- Sage Pastel Payroll Intelligence Reporting
- Sage 100/200 Evolution Intelligence Reporting
- Sage 100 Intelligence Reporting
- Sage 300 Intelligence Reporting
- Sage 500 Intelligence Reporting
- Sage VIP Intelligence Reporting
Additional Reports
Download our latest Report Utility tool, giving you the ability to access a library of continually updated reports. You don’t need to waste time manually importing new reports, they are automatically imported into the Report Manager module for you to start using.Sage Intelligence Tips & Tricks
Our Sage Intelligence Tips and Tricks will help you make the most of your favorite reporting solution.Excel Tips & Tricks
Our Excel Tips and Tricks will help you improve your business reporting knowledge and skills.- Learning
- Support
All Solutions
- Standalone Reporting Tool
- Sage Intelligence for Accounting
- Sage 300cloud Intelligence
- Sage 50cloud Pastel Intelligence Reporting
- Sage Pastel Payroll Intelligence Reporting
- Sage 100/200 Evolution Intelligence Reporting
- Sage 100 Intelligence Reporting
- Sage 300 Intelligence Reporting
- Sage 500 Intelligence Reporting
- Sage VIP Intelligence Reporting
Additional Reports
Download our latest Report Utility tool, giving you the ability to access a library of continually updated reports. You don’t need to waste time manually importing new reports, they are automatically imported into the Report Manager module for you to start using.Sage Intelligence Tips & Tricks
Our Sage Intelligence Tips and Tricks will help you make the most of your favorite reporting solution.Excel Tips & Tricks
Our Excel Tips and Tricks will help you improve your business reporting knowledge and skills.Get Support Assistance
Can’t find the solution to the challenge you’re facing in the resource library? No problem! Our highly-trained support team are here to help you out.Knowledgebase
Did you know that you also have access to the same knowledgebase articles our colleagues use here at Sage Intelligence? Available 24/7, the Sage Intelligence Knowledgebase gives you access to articles written and updated by Sage support analysts.Report Writers
Having some trouble creating or customizing the exact report you need to suit your business’s requirements? Contact one of the expert report writers recommended by Sage Intelligence.- Sage City
- University
- About Us
- Contact Us
Exploring Power BI with Sage Intelligence
For over a decade, Sage Intelligence has delivered on-premise solutions on almost every continent. We have amounted 100s and thousands of customers through our innovative reports and software. As can be expected, we have obtained a vast amount of expertise in both financial and operational reporting. For a long time, Excel has been our go-to area […]
3 Easy steps to create a forecast report in Microsoft® Excel® 2016
Have you ever needed to create a forecast report in Microsoft® Excel®? How did you calculate the projections? Whichever methods you used, Microsoft has made this much simpler with a new feature called Forecast Sheet. All you need to do is provide the input, and with a single click of the new Forecast Sheet button, Excel […]
Conveniently remove blank item rows in your PivotTable reports
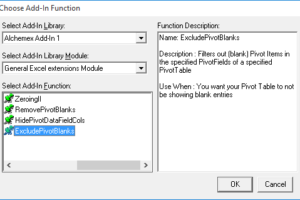
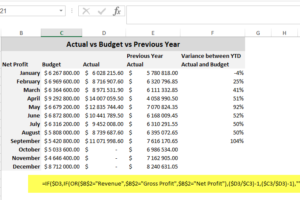
When creating reports, it’s usually preferred that rows with irrelevant data are excluded—as this results in a tidier, more readable report. When it comes to PivotTable reports, this can include rows with blank items. Below is an example of a report with them shown. To get rid of them, we have an add-in specifically for […]
How to automatically open a frequently used workbook
If you start each day needing to use a frequently used workbook, e.g. daily sales report, to-do list, calendar, etc, then this tip is for you. You can automatically open these workbooks, by simply adding the workbooks or a shortcut in the XLStart folder. This is a specific folder that Microsoft® Excel® uses in which files […]
How to extract the formula text in Excel
Auditing and troubleshooting formulas in Microsoft® Excel® can be time consuming and difficult. That is why the FORMULATEXT function is helpful because it simplifies formulae error checking and correction. The formula text can easily be extracted without having to copy and paste. The FORMULATEXT function syntax has one required input—a reference to a cell or […]
Is Power BI really worth the hype?
Many years ago, when I was a young Business Intelligence (BI) Report Writer and long before Power BI, I remember seeing Excel 2010 for the first time—mesmerized by the striking animations that shimmer in the splash screen. I remember my excitement to play with it, like a child waiting to tear off the gift-wrap and […]
Easily start up other apps when running Sage Intelligence reports
When working with reports, you may make use of other tools to help analyze the data in them. For example; a calculator or notepad. Did you know that Sage Intelligence allows you to automatically open other programs when a report is run? Through the CmdExec add-in this is possible. In this tip, I’m going to […]
How to print different headers and footers for odd and even pages
If you’ve created a Microsoft® Excel® report that needs to be printed double-sided (e.g. booklet form), you may want to have your headers or footers printed on different sides of the paper—left hand side for odd pages, and right hand side for even pages. To achieve this effect, follow this tip and use the Page […]
How to enhance your chart data series using a pictograph
Charts are used for displaying data graphically, and they can be enhanced by using a pictograph. Pictographs use any picture you choose to represent as your data series in the charts. Icons can also be used as pictograph to represent data values in order to decrease the size of the graph. You will find the […]
Return to topLearning
Sage South Africa
© Sage South Africa Pty Ltd 2020
.
All Rights Reserved.