For over a decade, Sage Intelligence has delivered on-premise solutions on almost every continent. We have amounted 100s and thousands of customers through our innovative reports and software. As can be expected, we have obtained a vast amount of expertise in both financial and operational reporting. For a long time, Excel has been our go-to area of expertise, however, of late, we have turned our attention to Power BI. This post will tell you how you can get the most value out of using Power BI with Sage Intelligence.

Why Use Sage Intelligence in the first place?
Two words: “Useful Data”. To fully utilize the power of Power BI, you need one critical thing, and that is good, clean and CORRECT data. Sage Intelligence solutions make this available to you across the board, from financial to sales, to purchase data. Many customers do not realize that the friendly crew here at Sage Intelligence has already gone through the effort of writing SQL queries for you to pull the right data, in the right way, to enable you to get the most out of Excel. Now, with Sage Intelligence, you’re empowered to get the most out of Power BI with all its amazing desktop, cloud, and mobile features. Instead of hiring an SQL guru to pull your data into a format that Power BI can make sense of, why not use the same Sage Intelligence SQL Queries customers have trusted for over a decade to bring your data to life?
Why use Power BI if I have Excel?
Like a fish in water or a cheetah sprinting across the African savannah, Excel may be your muse, and you are comfortable there, so why go elsewhere? Well, here is the beauty of this whole thing, why not use both? Excel is a fantastic desktop program, however, its cloud and mobile derivatives leave much to be desired. This is where Power BI can fill that gap in your reporting needs. Happy with Excel on your desktop? Then stay there! However, interactive and gorgeous dashboards on both cloud and mobile platforms, all of which are free of charge, are available through Power BI. So why not make use of this, too? I also must add, that Power BI is constantly being updated with amazing features. At the time of this Blog, Power BI has just released a drill down feature on Matrixes (something like Pivot Tables). Excel has a drill down feature on Pivot Tables, where it opens a new sheet with your drill down data displayed. However, with Power BI, you stay on the same sheet, and can easily drill up or down when needed. Power BI definitely wins that round, #JustSaying.
Do you drink your own champagne?
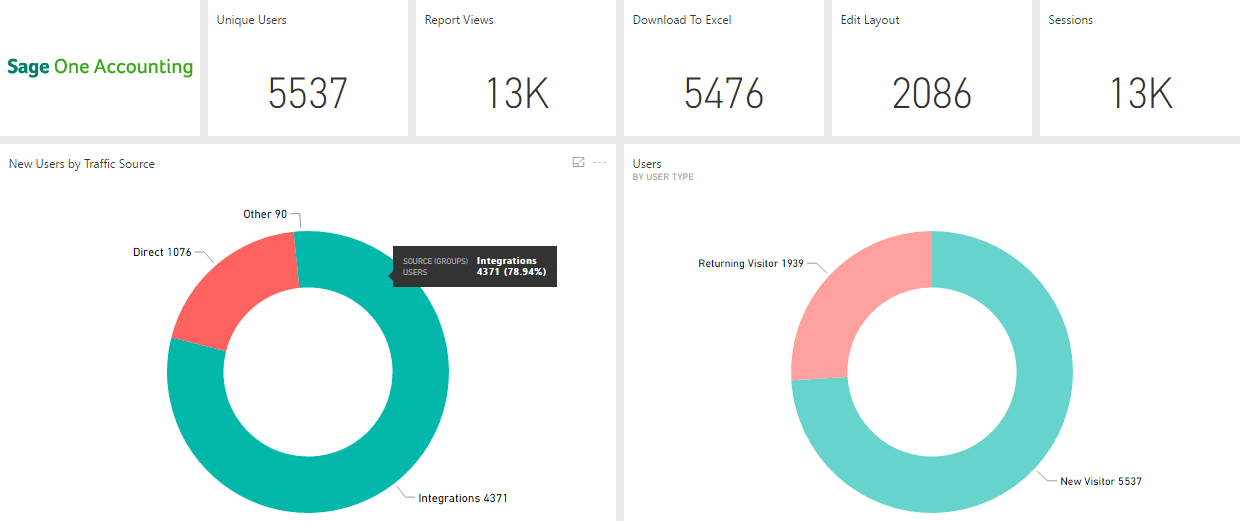
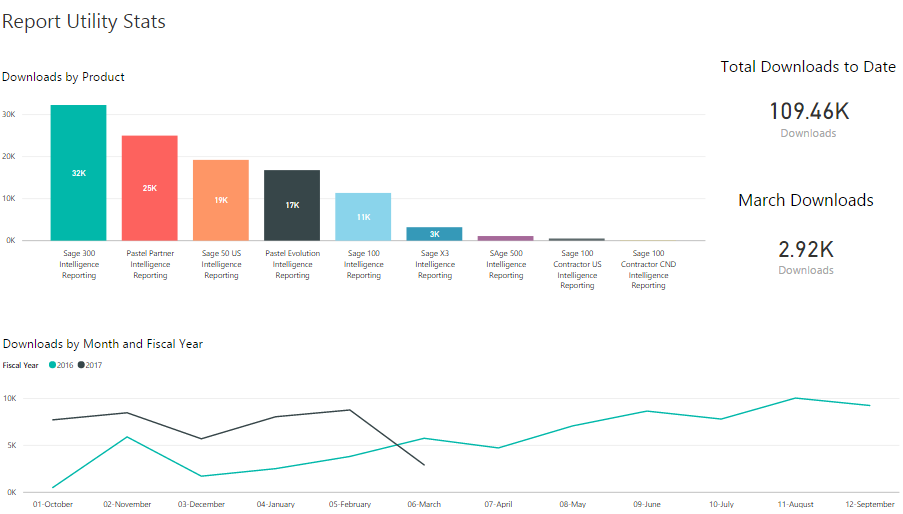
To be honest, alcohol really isn’t my thing, however, Power BI with Sage Intelligence is. I don’t know about you, but for me, going through uncharted territories kind of freaks me out. I would much rather use a guinea pig to test out my theories first. In this scenario, we here at Sage Intelligence were your guinea pig. We can attest to using this exact same strategy ourselves. Below is just one of many reports we generate using both Sage Intelligence and Power BI. We use Sage Intelligence and Power BI together to give us various insights into how well our Report Utility is doing. So yes, we do drink our champagne and not only that, we drink it every day.

How does this all work?
Instead of reading how it works, our product enablement team have put together some amazing step-by-step videos to show you how you can use Sage Intelligence with Power BI, to get the most out of your existing Sage Intelligence Report Manager and Power BI, all at no extra charge.

