Charts are used for displaying data graphically, and they can be enhanced by using a pictograph. Pictographs use any picture you choose to represent as your data series in the charts. Icons can also be used as pictograph to represent data values in order to decrease the size of the graph.
You will find the use of pictures in the charts data series easy to understand and read. A sales executive can replace the data series with a picture of the item they are selling. That picture represents a unit of measure for the item.
Follow the steps below as we explain how.
You are welcome to download the workbook to practice.
Applies To: Microsoft® Excel® 2010, 2013 and 2016.
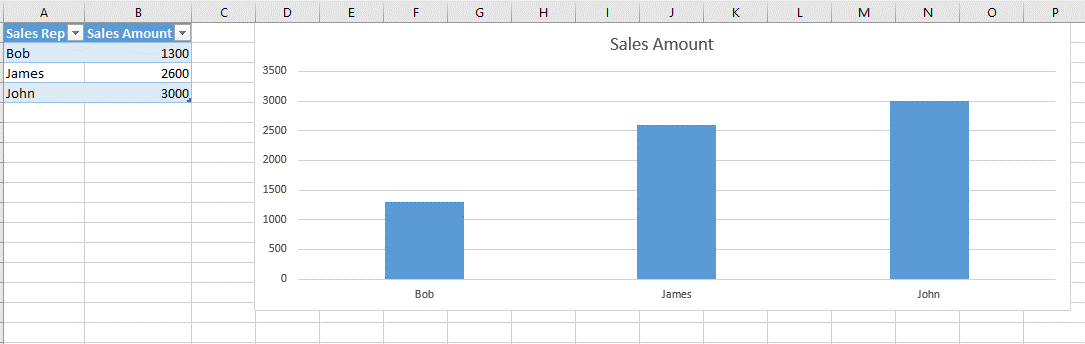
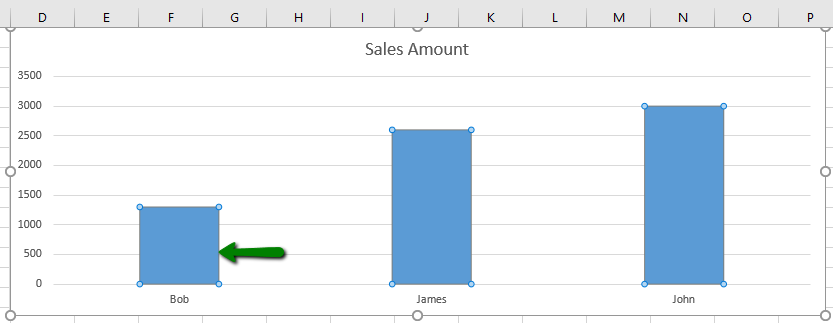
1.Below, we have a regular bar chart.
2. To convert this chart to a pictograph bar chart, simply navigate to the Insert tab and select Pictures as seen below. Thereafter choose the picture you want to use and select OK.
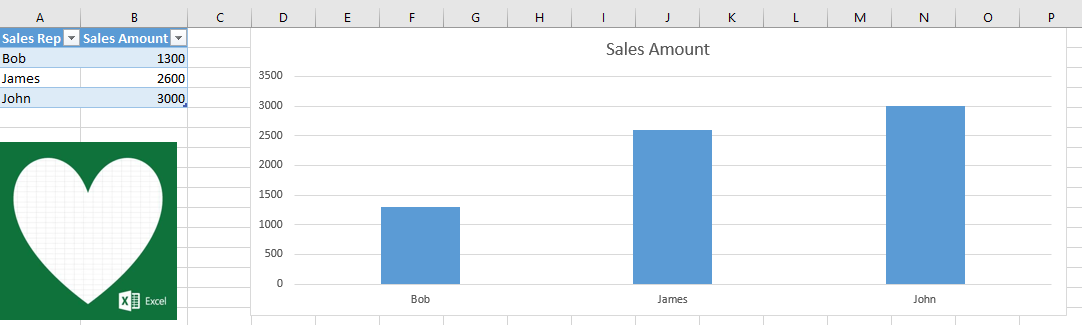
3. Your picture should now be in your workbook.
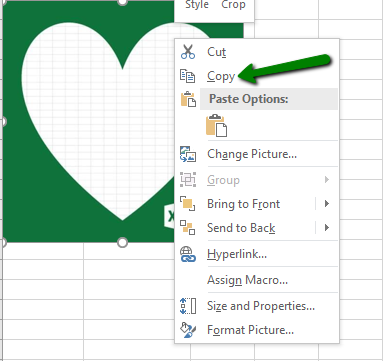
Right click on your image and copy it.
4. Select on any of the bars and paste your image, either by pressing “CTRL +V”, or navigating to the home tab and clicking the Paste.
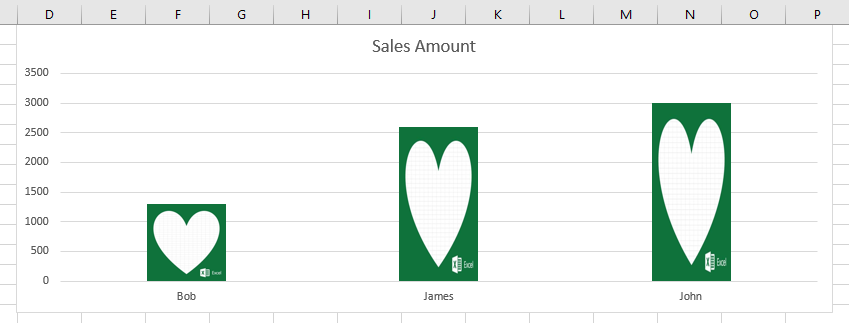
5. Your chart now looks like this:
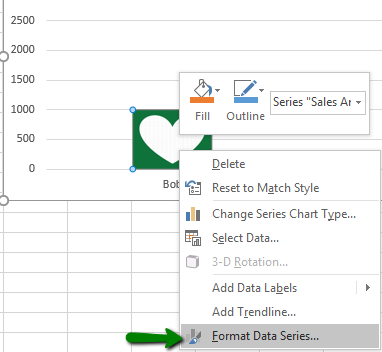
6. To add more relevance, right click on any of the data points. Then, select the “Format Data Series” option.
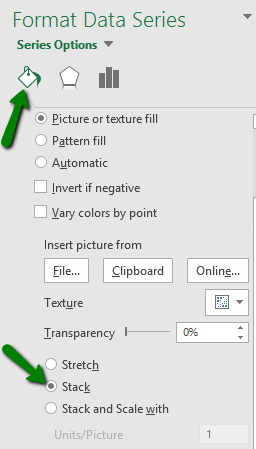
7. Under the fill and line tab, click on the “Stack” option as seen below.
8. Your end result should look like the below:
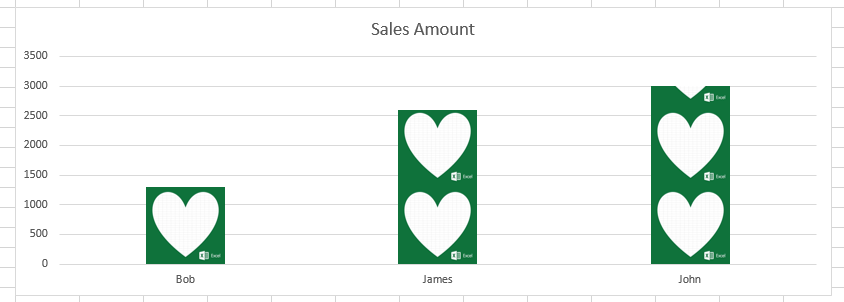
As you can see, the graph is easy to understand and read. Meaning you will not spend much time interpreting the results. It is also visually appealing, and therefore useful for presentations.
