This report gives you a dynamic view of your top 5, 10, 15 and 20 customers—depending on your requirements.
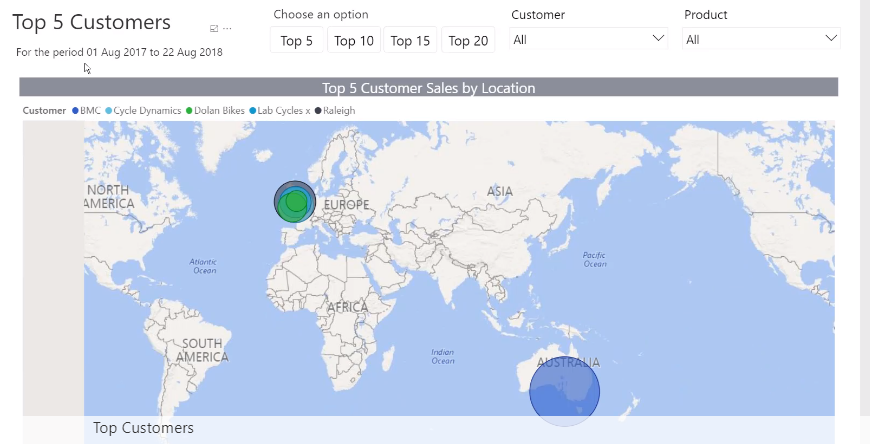
The first dashboard you’ll notice is a map chart, which opens up after you’ve entered your required from and to date. This map chart highlights the amount of Sales per Customer by Location. The size of the bubble indicates the amount of sales—meaning that you’ll be hoping to see a few large circles on this map!
More information on the specific tiles and pieces of the dashboard can be obtained by clicking on the (i) icon.
You’re able to choose to view your Top 5, 10, 15 or Top 20 customers in this map. You can further filter the report by individual customer or by all customers, as well as by individual product or all products.
By right-clicking on a specific circle on the map, you can select to See Records—which will take you to a table that shows all relevant information relating to your selection. Simply click on the back-arrow to go back to the main dashboard. Then, by right-clicking again on a specific circle and selecting See Data, you’ll be taken to another table which reveals a summary of the amount of Sales per Customer by Location.
If you select the Top Customer Dashboard tab near the bottom of the report, you’ll get a glimpse of your top 5, 10, 15, or 20 customers in a bar chart format. By right-clicking on a specific customer and selecting See Records, you’ll be lead to a table that reveals your sales per transaction for this customer. You can also filter this bar chart by individual customer and by product.
The last dashboard listed in the tabs near the bottom of your report is the Top Customers by Product Dashboard. With this dashboard, you’re able to filter by your top 5, 10, 15, or top 20 customers, or by choosing an individual customer, or an individual product. If you then right-click on an amount in the table and select See Records, you’ll be taken to a detailed table of all transactions that make up the amount selected. By right-clicking on an amount in the table and selecting Drill-through, you’ll also get a different view of your information.
These Additional Reports will give you a deeper understanding of your business!
Click on the report below that you want to find out more information on, and discover the incredible impact it will have on your business:
- Get a dynamic view of your top customers with the Top Customers Analysis report.
- View quantities and values of stock purchased and sold with the Stock Movement report.
- Get an overview of your purchasing behaviour with the Purchase Analysis report.
- Flag customers who owe you money with the Overdue Customers report.
- Get an accurate view of your cash in and out with the Cash Book Analysis report.
