This report gives you an accurate view of the cash you’ve received into your bank account and what you’ve paid out. With this report, you’ll also be able to drill-down to the individual transactions on a specific day.
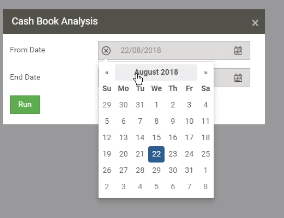
To run this report, you’ll first choose the from and to date by simply clicking on the date selector to expand it further:
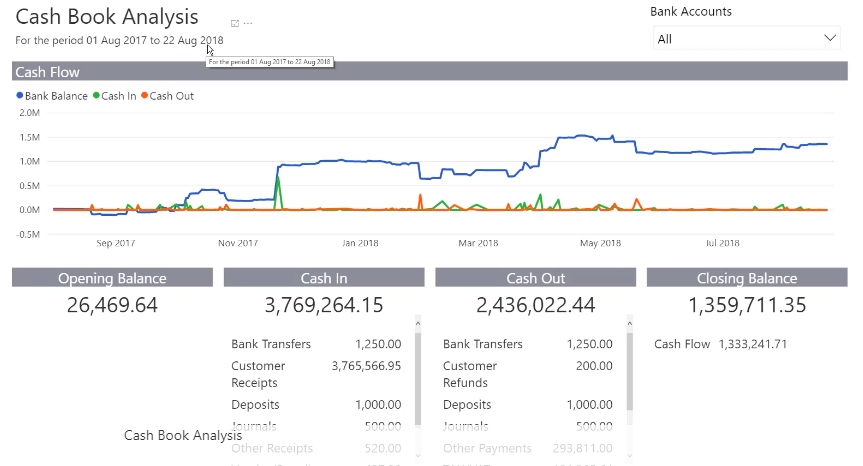
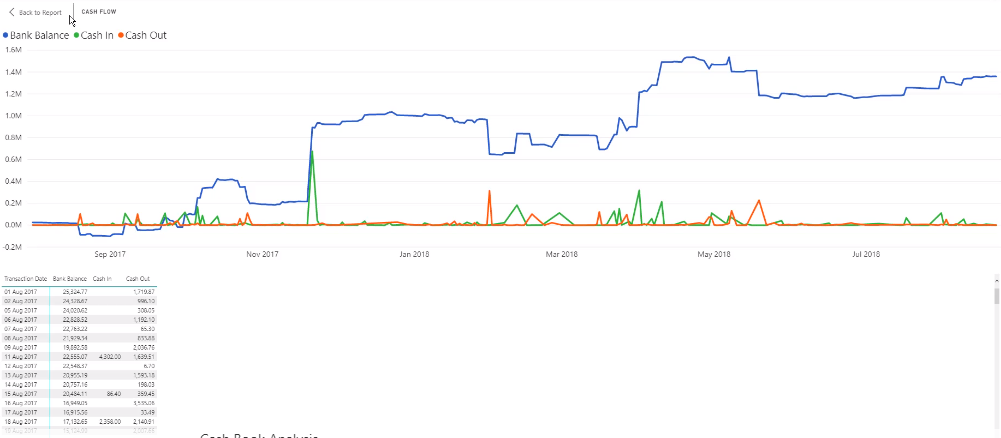
The Cash Book Analysis report will then run out for the dates that you have selected:
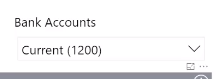
You can either choose to run the report out for a selected bank account, or you can choose to run it out for all of your bank accounts:
The Cash Flow chart will visually present you with your monthly bank balance, as well as the cash in and cash out amounts. You’re then able to right-click on the chart at any point in the selected period, and select the Show Data option.
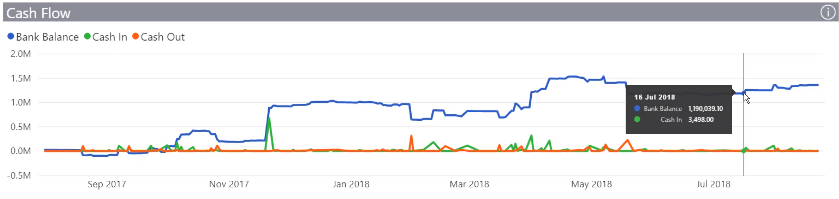
Show Data will expand the chart even further to reveal the selected period and your bank balance, cash in and out amounts per day.
By clicking on the Back to Report option, you’ll be directed back to the main dashboard. From here, you’re able to right-click and drill-through to the transaction detail for the day. This summary includes all transaction details for the day, for example; payment reference number , value, etc.
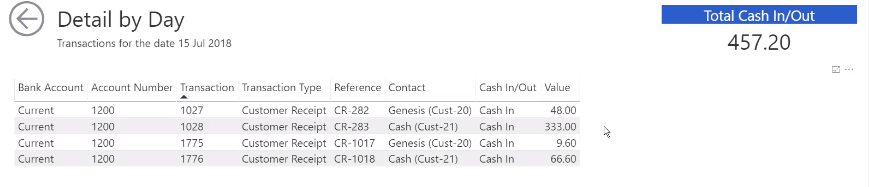
Click on the back arrow to go back to the main dashboard.
The summary below the chart shows you your opening bank balance for the period you have selected, as well as your cash in and cash out. This then gives you your closing balance for the selected period. By hovering over the (i) icon, you’ll be able to discover more information about each tile.
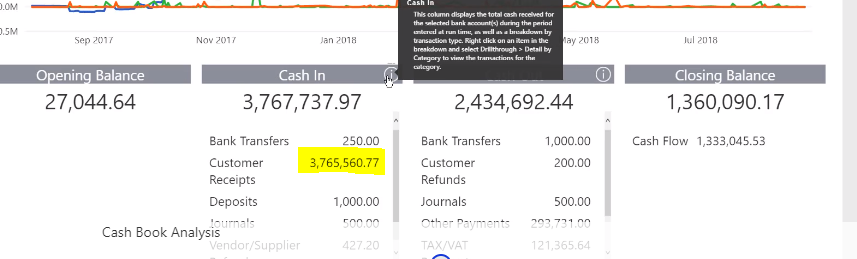
By right-clicking on an amount (for example, the one highlighted above), you’re able to Show Data that will give you a summary of the transactions that made up the amount. If you choose to select Drill-through by right-clicking on an amount, you’re able to see a detailed summary of each transaction that makes up the amount—including references, dates and invoice numbers.
These Additional Reports will give you a deeper understanding of your business!
Click on the report below that you want to find out more information on, and discover the incredible impact it will have on your business:
- Get a dynamic view of your top customers with the Top Customers Analysis report.
- View quantities and values of stock purchased and sold with the Stock Movement report.
- Get an overview of your purchasing behaviour with the Purchase Analysis report.
- Flag customers who owe you money with the Overdue Customers report.
- Get an accurate view of your cash in and out with the Cash Book Analysis report.
