How to use the new “Up to Period” filter in Sage Intelligence for Accounting

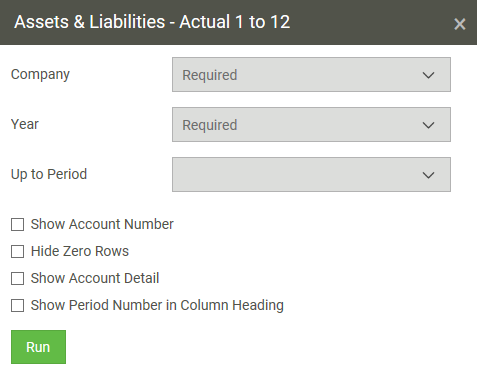
Sage Intelligence now allows you to filter your report based on a fiscal period. No more cluttered reports, and no more redundant editing of report layouts to get your desired results! How Sage Intelligence determines Fiscal Periods Before we dive into the new ‘Up to Period’ feature, it is important for you to understand how […]

Continue reading


Get access to Additional Reports on an ongoing basis in Sage Intelligence for Accounting!

With the new release of Sage Intelligence for Accounting, you’ll not only notice a fresh, new user interface that’s easy on the eyes, but also a redefined user experience that will help make your reporting solution even more intuitive and easy to use. But here’s the best part. We’ve also added a new Additional Reports […]

Continue reading


Get a dynamic view of your top customers with the Top Customers Analysis report

This report gives you a dynamic view of your top 5, 10, 15 and 20 customers—depending on your requirements. The first dashboard you’ll notice is a map chart, which opens up after you’ve entered your required from and to date. This map chart highlights the amount of Sales per Customer by Location. The size of the bubble indicates the […]

Continue reading


View quantities and values of stock purchased and sold with the Stock Movement report

This report displays the quantities and values of stock purchased and sold from the start date you enter at runtime to the current date, broken down by product.  It also includes opening and closing stock amounts.  This enables you to tell, at a glance, whether you’re perhaps overstocking or understocking on certain items, and whether […]

Continue reading


How to create a linked dashboard (or landing page) for your Excel workbook

Have you ever had the pleasure (or displeasure) of working with an extra large Excel workbook with many, many different sheets? This happens frequently, especially if you are working with a large amount of data that needs to be analyzed periodically. This may be due to multiple tables, lookups, references, charts, graphs etc. This has […]

Continue reading