This report gives you an overview of where, and from whom, you’re purchasing goods and services based on the date selection you have made.
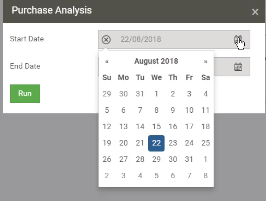
To run this report, you’ll first choose the from and to date by simply clicking on the date selector to expand it further:
The Purchase Analysis by Region report will then open for the period stipulated. You’ll immediately notice that there’s a map that shows you the location of your purchases, as well as a City Trend Analysis—which highlights your purchases per city over a given time.
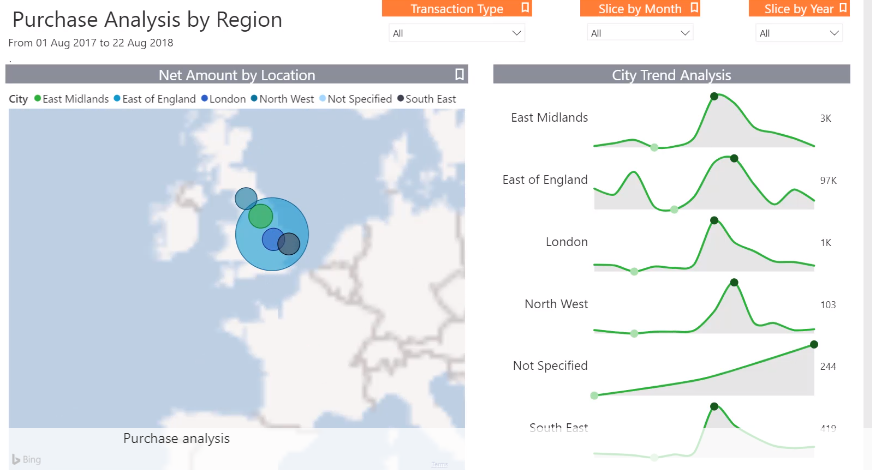
You can then filter by transaction type, for example; by an individual type such as purchase invoices, or by all transactions. You can also filter by month or months, as well as by year or years.
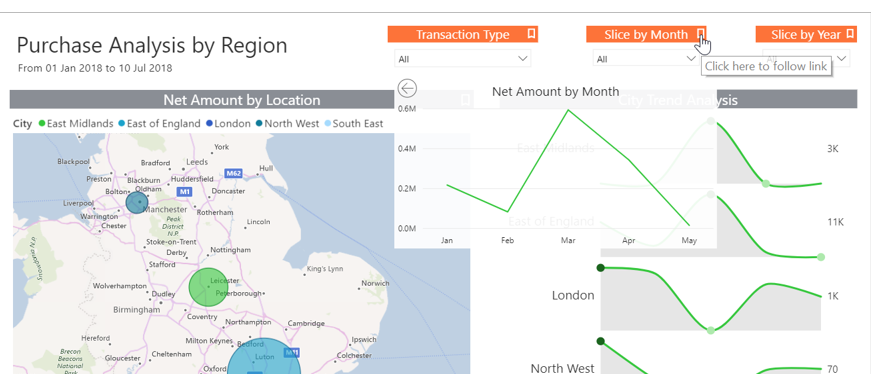
By clicking on the bookmark icon above these slicers, graphs will appear. This shows you more information about your purchases based on the slicers you have selected.
The dashboard is also interactive. If you click on one of the coloured purchase circles on the map, the city trend analysis will be filtered depending on your selection. Similarly, if you right-click on the City Trend Analysis, the map will update accordingly.
If you then right-click on the map and select Show Data, a table will appear that shows you your purchases per city.
Click on the Back to Report option to go back to the dashboard.
The Purchase Analysis by Date tab near the bottom of the report leads to a different dashboard. This dashboard is also interactive, and so by clicking on a certain supplier or vendor, for example, Traxx—the rest of the dashboard will filter by your selection.
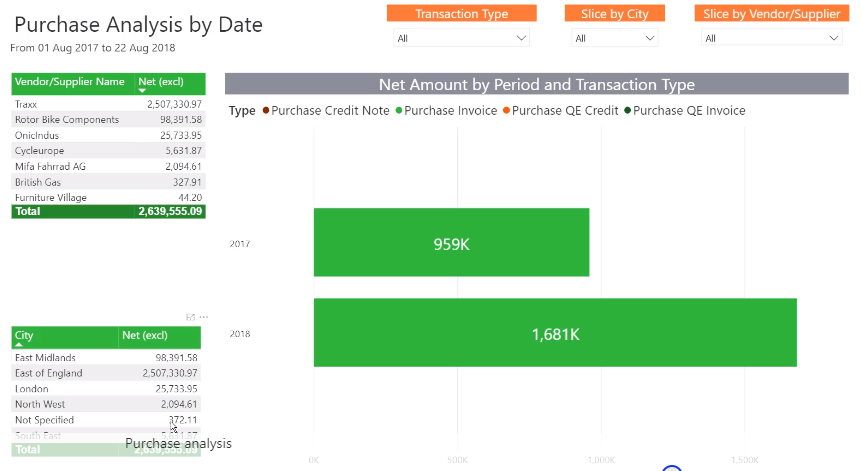
If you then right-click on 2017 and select Drill Down, the Net Amount by Period and Transaction Type will drill through to months. If you again right-click on a specific month and select Drill Down, you will drill-through to transactions per day.
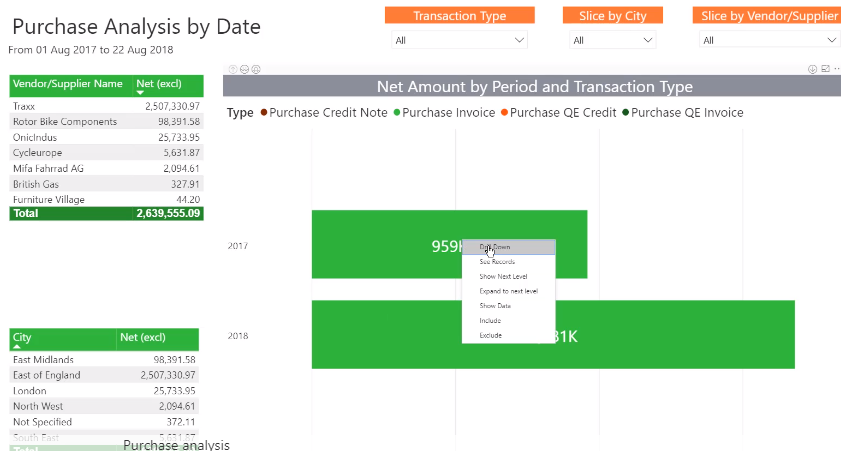
That’s not all! You’re also able to go even deeper into your business’s information. Simply right-click on any day and select See Records. A new window will open that details all the transactions for the day. You can also filter the dashboard by supplier or vendor by using the drop down underneath the Slice by Vendor/ Supplier tile.
These Additional Reports will give you a deeper understanding of your business!
Click on the report below that you want to find out more information on, and discover the incredible impact it will have on your business:
- Get a dynamic view of your top customers with the Top Customers Analysis report.
- View quantities and values of stock purchased and sold with the Stock Movement report.
- Get an overview of your purchasing behaviour with the Purchase Analysis report.
- Flag customers who owe you money with the Overdue Customers report.
- Get an accurate view of your cash in and out with the Cash Book Analysis report.
