In our last tip, we looked at the functionality of the different icons provided on the Report Manager menu ribbon. You can find this tip here. Now, we’re going to do the same for the Connector module. Take note that icons will activate / deactivate based on your selection in the object window. These icons are […]
- Solutions
All Solutions
- Standalone Reporting Tool
- Sage Intelligence for Accounting
- Sage 300cloud Intelligence
- Sage 50cloud Pastel Intelligence Reporting
- Sage Pastel Payroll Intelligence Reporting
- Sage 100/200 Evolution Intelligence Reporting
- Sage 100 Intelligence Reporting
- Sage 300 Intelligence Reporting
- Sage 500 Intelligence Reporting
- Sage VIP Intelligence Reporting
- Resources
All Solutions
- Standalone Reporting Tool
- Sage Intelligence for Accounting
- Sage 300cloud Intelligence
- Sage 50cloud Pastel Intelligence Reporting
- Sage Pastel Payroll Intelligence Reporting
- Sage 100/200 Evolution Intelligence Reporting
- Sage 100 Intelligence Reporting
- Sage 300 Intelligence Reporting
- Sage 500 Intelligence Reporting
- Sage VIP Intelligence Reporting
Additional Reports
Download our latest Report Utility tool, giving you the ability to access a library of continually updated reports. You don’t need to waste time manually importing new reports, they are automatically imported into the Report Manager module for you to start using.Sage Intelligence Tips & Tricks
Our Sage Intelligence Tips and Tricks will help you make the most of your favorite reporting solution.Excel Tips & Tricks
Our Excel Tips and Tricks will help you improve your business reporting knowledge and skills.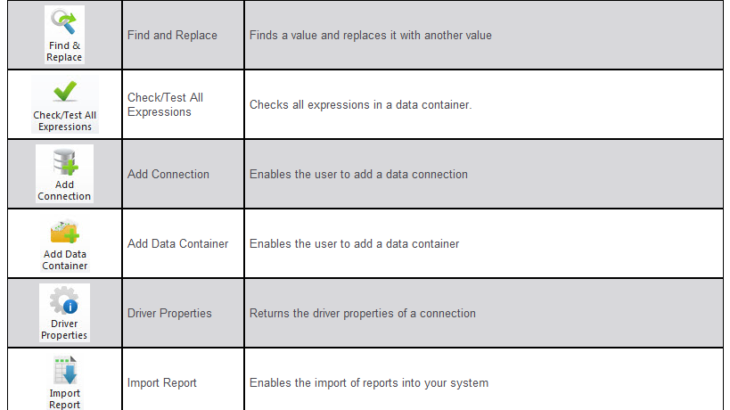
Get a dynamic view of your top customers with the Top Customers Analysis report
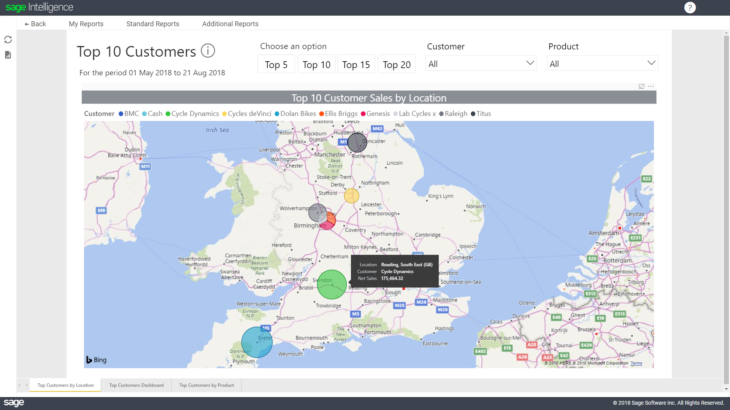
This report gives you a dynamic view of your top 5, 10, 15 and 20 customers—depending on your requirements. The first dashboard you’ll notice is a map chart, which opens up after you’ve entered your required from and to date. This map chart highlights the amount of Sales per Customer by Location. The size of the bubble indicates the […]
View quantities and values of stock purchased and sold with the Stock Movement report

This report displays the quantities and values of stock purchased and sold from the start date you enter at runtime to the current date, broken down by product. It also includes opening and closing stock amounts. This enables you to tell, at a glance, whether you’re perhaps overstocking or understocking on certain items, and whether […]
Get an accurate view of your cash in and out with the Cash Book Analysis report
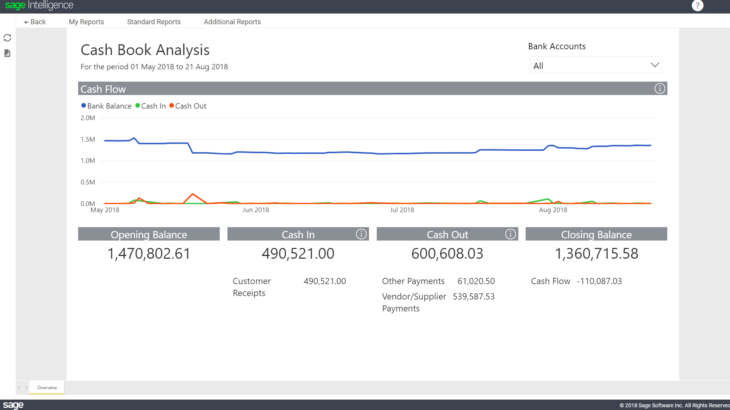
This report gives you an accurate view of the cash you’ve received into your bank account and what you’ve paid out. With this report, you’ll also be able to drill-down to the individual transactions on a specific day. To run this report, you’ll first choose the from and to date by simply clicking on the […]
Learn the various Report Manager menu ribbon functions
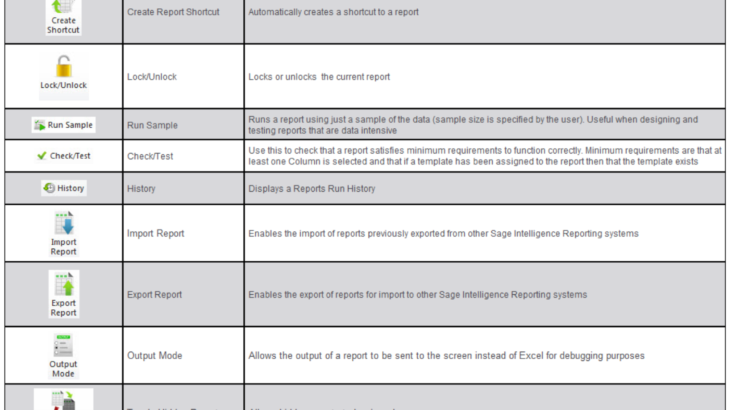
When you use the Sage Intelligence Report Manager module, you will see an array of icons on the menu ribbon. Here is a quick tip on their functionality. Take note that icons will activate / deactivate based on your selection in the object window. These icons are available on software using Sage Intelligence Core 7.3 […]
Interactive dashboards now live in Sage Intelligence for Accounting!
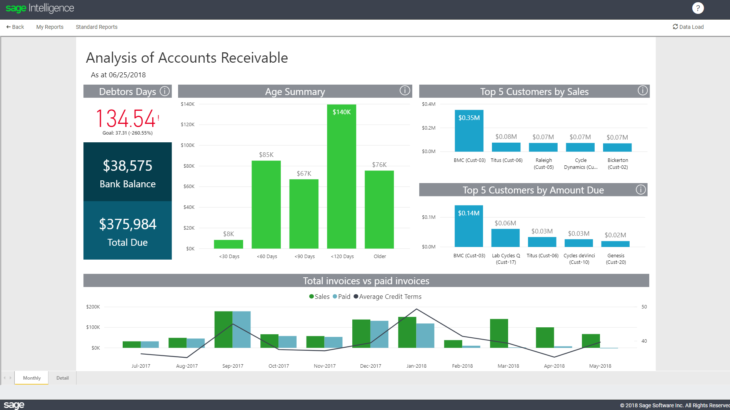
Sage Intelligence has introduced five interactive dashboard reports to Sage Business Cloud Accounting that give you regular insights into your business’s key performance indicators. With these improved reports, you’ll be empowered with the ability to drill down into the detail of your information so that you can make faster decisions and act more decisively. Get […]
Track your creditors with the Analysis of Accounts Payable report
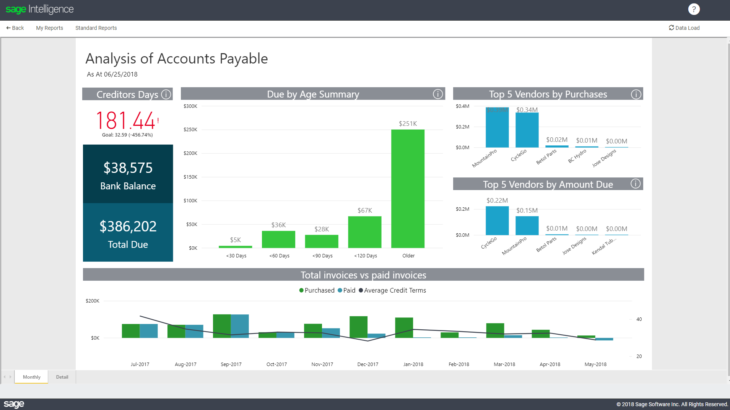
The Analysis of Accounts Payable report will help you to effectively manage who you owe money to. As a business owner, you’ll need to know how much money you’re expected to pay your suppliers within your credit terms, and which payments you can potentially push out to help manage your cash flow more appropriately. Looking […]
Track your creditors with the Analysis of Aged Creditors report
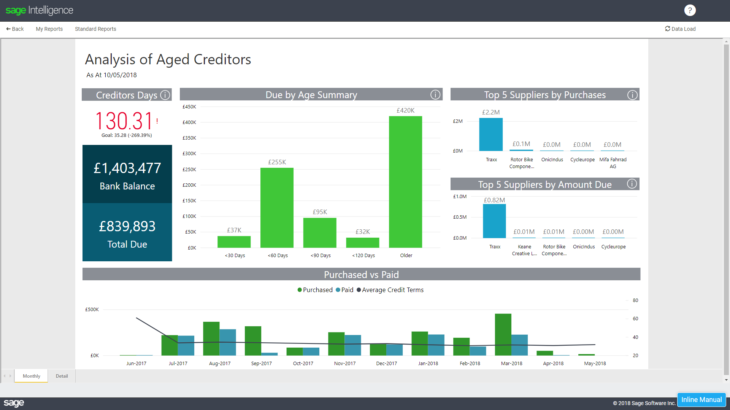
The Analysis of Aged Creditors report will help you to effectively manage who you owe money to. As a business owner, you’ll need to know how much money you’re expected to pay your suppliers within your credit terms, and which payments you can potentially push out to help manage your cash flow more appropriately. Looking […]
Learn how to share your report between different users and companies

Did you know that in Sage Intelligence you can design a report in one company and view that same report in a different company? That’s right, just as long as those companies carry the same account structure, you can share your report. This report will go through the following process: Designed in one company Exported […]
Three ways to use a Consolidation Connection in Sage Intelligence
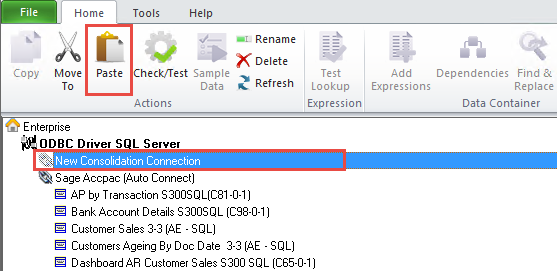
In our last tip, I showed you how to create a Consolidation Connection in the Connector module, which lets you combine data from different companies into a single report to obtain a holistic view of your organization. If you would like to review the tip, you can find it here. Once one is created, there […]
 © Sage South Africa Pty Ltd 2020
.
All Rights Reserved.
© Sage South Africa Pty Ltd 2020
.
All Rights Reserved.