This report displays the quantities and values of stock purchased and sold from the start date you enter at runtime to the current date, broken down by product. It also includes opening and closing stock amounts. This enables you to tell, at a glance, whether you’re perhaps overstocking or understocking on certain items, and whether you have enough stock to meet short term commitments.
The Stock Movement Dashboard that opens up after you’ve entered your required from and to date displays the Opening Quantity, Quantity In and Out, and the Closing Quantity for all stock items. Similarly, it also displays the Opening Value in the currency you report in, the Value In and Out, and the Closing Value for all stock items in the specified period.
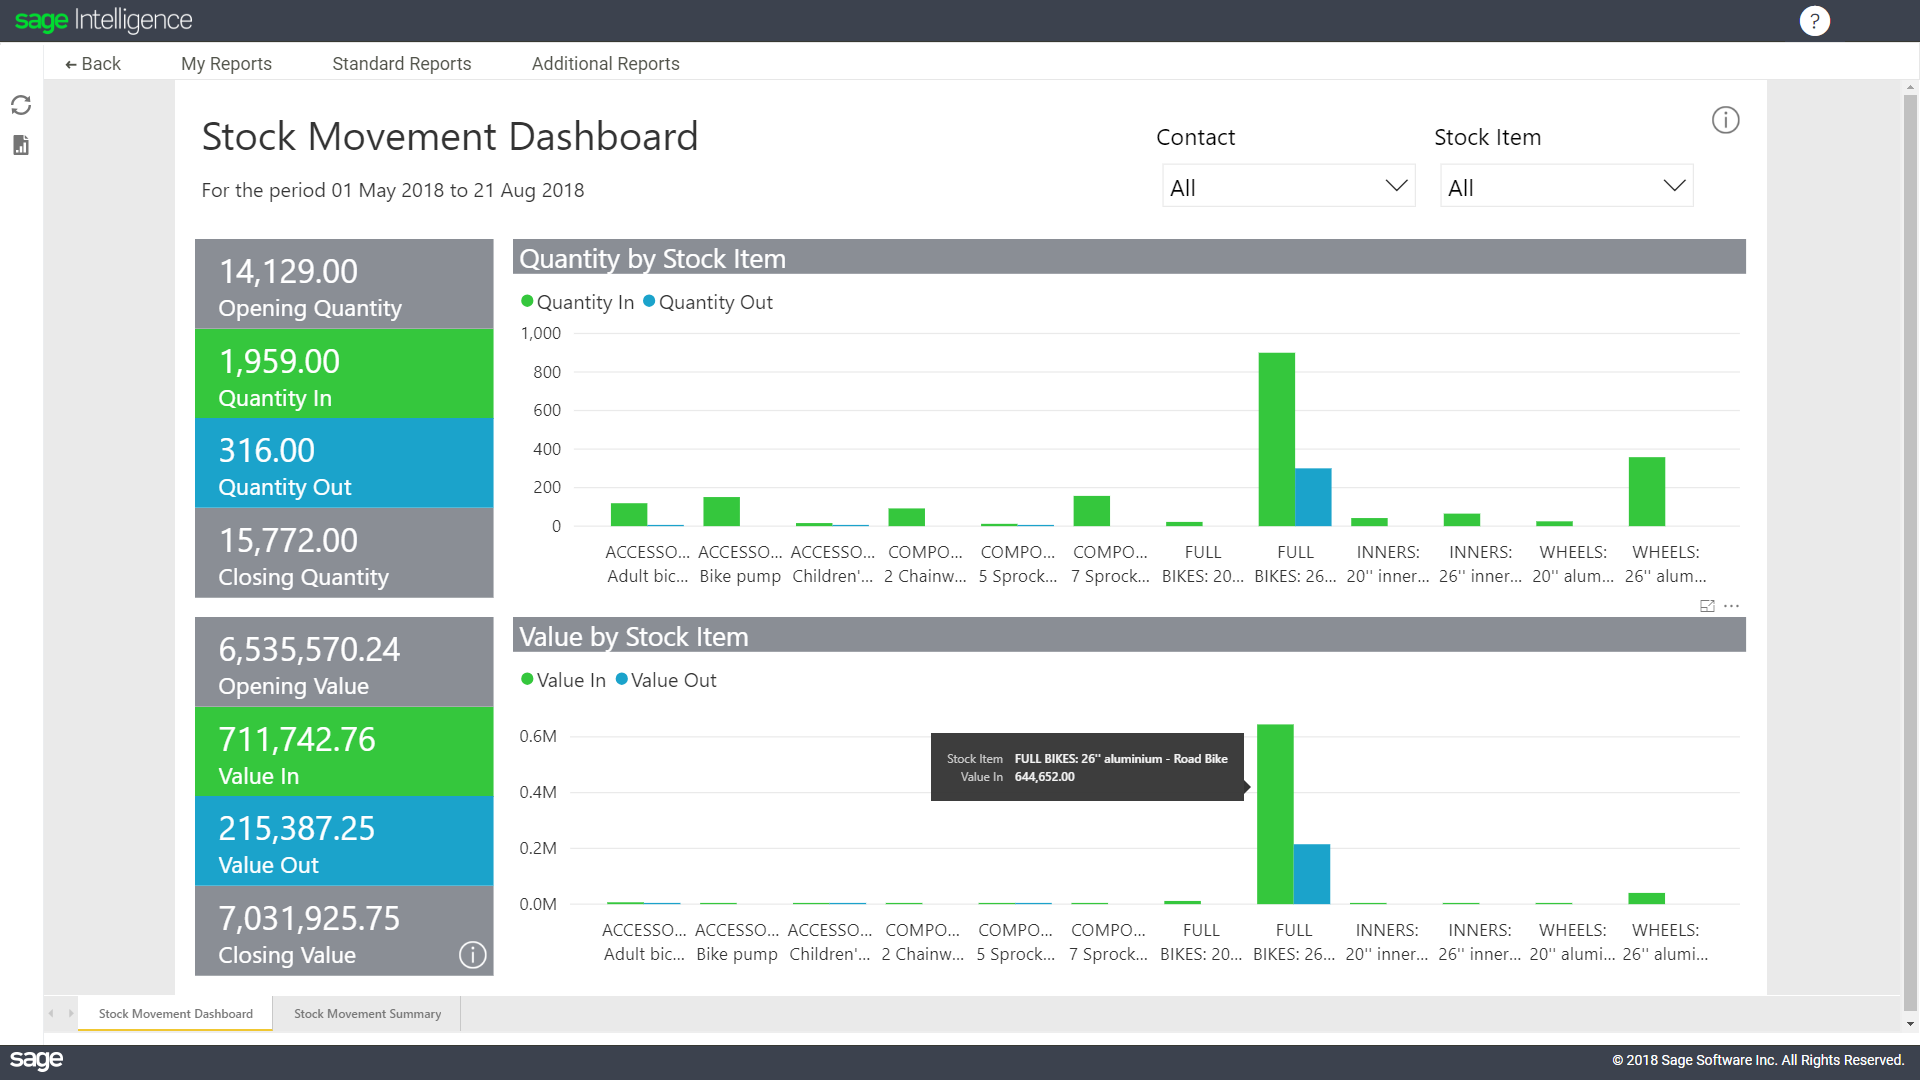
You can then filter by contact by using the drop-down arrow underneath the Contact tile and simply ticking your selection. In this example, we’ve selected Rotor Bike. The dashboard is also interactive and therefor filters depending on the selected contact. By right-clicking on a specific stock item (for example, wheels) and selecting the Drill-through option, you’ll be taken to the Stock Movement Detail report.
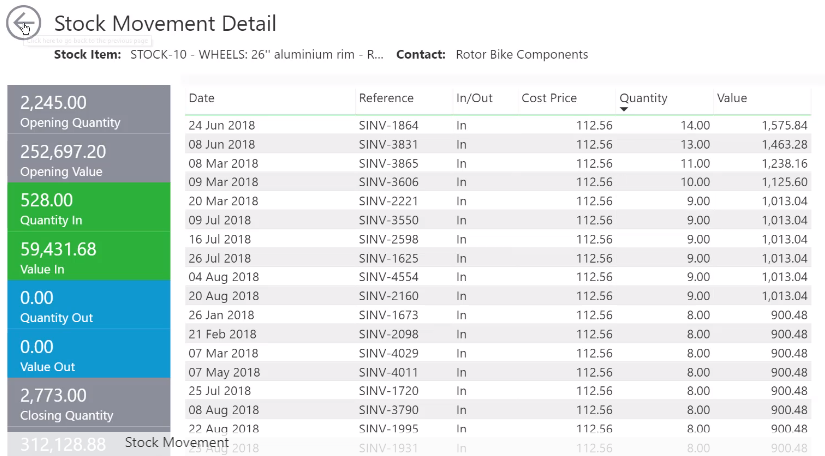
This report provides you with all transactional details relating to this specific stock item, for example; Value (in the currency you’re reporting in) and Quantity per Invoice.
Click on the back-arrow to go back to the main dashboard.
You can also filter the dashboard by a specific stock item, or a collection of stock items. Green represents the Quantity and Value of stock coming in, while blue represents the Quantity and Value going out. By right-clicking and selecting the Drill-through option, you’ll again be taken to the Stock Movement Detail report.
This Stock Movement Detail report will then reveal specific items coming into stock by their stock code, as well as those going out. It also shows you the Cost Price, Quantity, and Value per item.
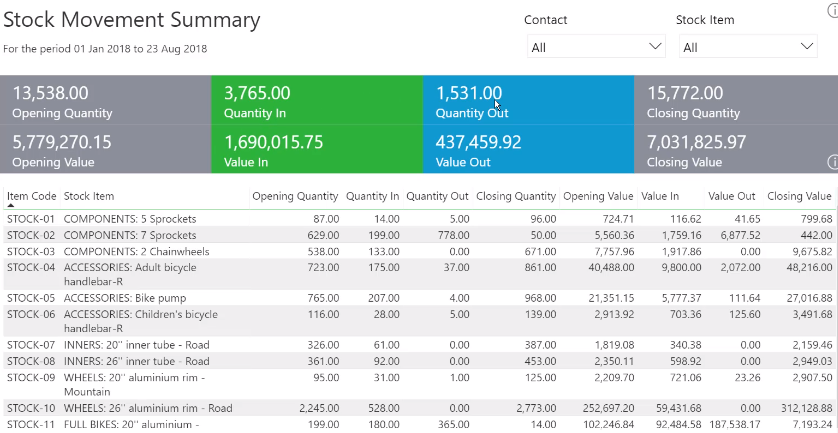
The Stock Movement Summary dashboard provides you with a tabular summary of all stock items. You can further filter this dashboard by Stock Item or by Contact—depending on your requirements. All relevant information regarding the item you’ve selected will then be displayed.
These Additional Reports will give you a deeper understanding of your business!
Click on the report below that you want to find out more information on, and discover the incredible impact it will have on your business:
- Get a dynamic view of your top customers with the Top Customers Analysis report.
- View quantities and values of stock purchased and sold with the Stock Movement report.
- Get an overview of your purchasing behaviour with the Purchase Analysis report.
- Flag customers who owe you money with the Overdue Customers report.
- Get an accurate view of your cash in and out with the Cash Book Analysis report.
