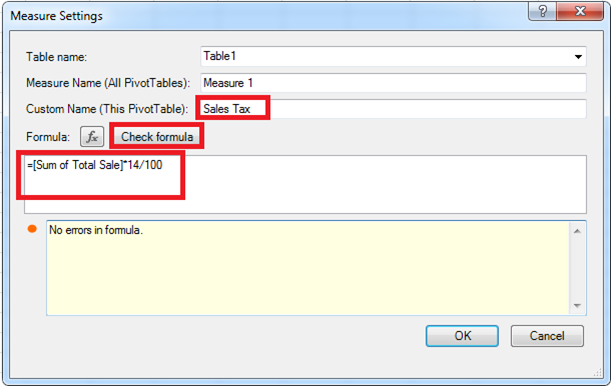
3 PivotTable Improvements in Microsoft Excel 2016

The PivotTable is one of the easiest tools used to transform huge amounts of data into meaningful reports. Excel didn’t disappoint with the improvements that have been made to PivotTables in their 2016 version. These include the following; Field List search, Automatic Time Grouping, and Multi-select Slicers. In this tip, we explore some improvements made […]

Continue reading


Enable the recipients of your distributed reports to interact with PivotTables like you do

Have you ever distributed reports containing PivotTables and found that your recipients aren’t able to interact with them, only having a snapshot of the data? Wouldn’t it be great if they could have some of the same functionality you do, like the ability to filter, drill down, or add other fields that may be of […]

Continue reading


Improve your finance team’s financial reporting in Excel

Sage Intelligence recently launched an exciting online course for Microsoft® Excel® 2013 which will help you not only move to the next level of financial reporting, but also improve inefficiencies in your company. There are many useful features covered in this course, but in this article, we focus on three particular functions that highlight the […]

Continue reading


Easily organize data in Excel using multiple data consolidations for PivotTables

The PivotTable is an effective tool for working with large volumes of data, it allows you to  summarize, organize and view the same data in many different ways quickly and easily. By using the PivotTable multiple consolidation ranges option you can create a PivotTable that consolidates data from more than one worksheet. This can greatly […]

Continue reading