The PivotTable is an effective tool for working with large volumes of data, it allows you to summarize, organize and view the same data in many different ways quickly and easily.
By using the PivotTable multiple consolidation ranges option you can create a PivotTable that consolidates data from more than one worksheet. This can greatly enhance your decision making.
In this week’s tip we’ll explain how, as we take you through the workbook exercise.
You are welcome to download the workbook to practice.
Applies To: Microsoft® Excel® 2010 and 2013.
1. Select any cell on the 2013 worksheet, then Press ALT and D (release your fingers from the keyboard) and Press P.
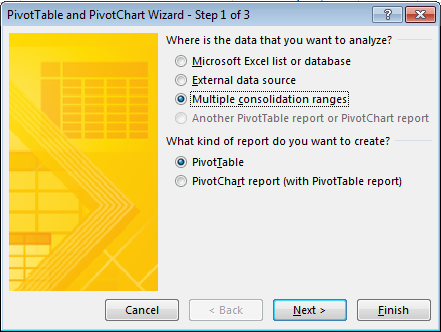
2. Select Multiple Consolidation ranges and PivotTable.
3. Click Next and Next again.
4. Click the Collapse button (red icon) and then press CTRL and A.
5. Click the Collapse button (red icon) and then click the Add button.
6. Click the Collapse button (red icon) and then click on the 2014 worksheet tab.
7. Press CTRL and A and click the Collapse button (red icon).
8. Then click the Add button.

9. Click Next then click Finish..
10. Click the drop down arrow in cell B3 and select only Product Sales and then click OK.
11. Right click on one of the values and select Summarize values by.
12. Select Sum, then select the Design tab.
13. In the layout group, select Grand Totals.
14. Select off for rows and columns.
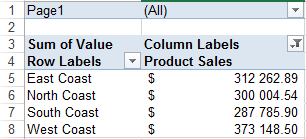
As you can see a PivotTables that consolidates data from multiple worksheets has been created. This will enhance your decision making and make your process of organizing your data more efficient.
Please ensure that the first columns in all the worksheets are identical. In our example the first columns were for the branch names.
