The Analysis of Accounts Payable report will help you to effectively manage who you owe money to. As a business owner, you’ll need to know how much money you’re expected to pay your suppliers within your credit terms, and which payments you can potentially push out to help manage your cash flow more appropriately.
Looking at this Dashboard, you’re able to visualise the point that your Creditors Days are 181.44 and, in the red. This means that on average, you’re paying your creditors every 181.44 days compared to the average credit terms of 32.59. Looking at this dashboard, something doesn’t look right. This may lead to further investigations.
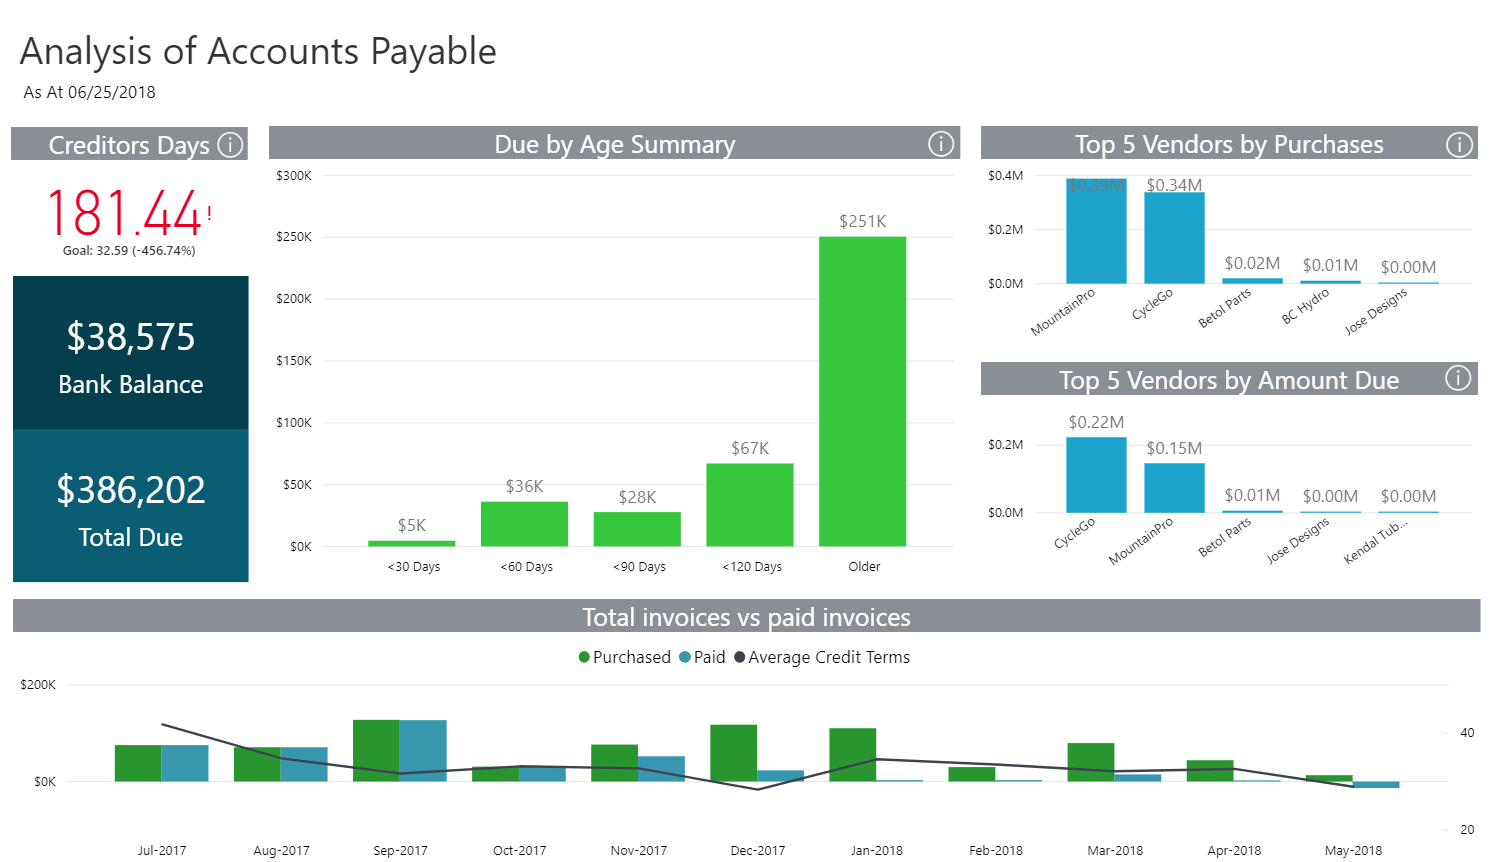
Looking at the Due by Age Summary, a business owner can see the total amount outstanding to creditors, as well as for how long it’s been outstanding. In this example, you’re able to see straight away that there’s $251k sitting in the Older Than 120 Days column. You can then drill down into this summary and view how much you owe and to who, as well as the number of days the amounts have been outstanding.
Here we can see that most of the outstanding amount in Older Than 120 Days is split between two companies, CycleGo and MountainPro. If you then right click on the specific supplier and click on Drill through, you’re able to immediately drill down to the specific Supplier information. For example, you’re able to determine who the contact person for CycleGo is, and what invoices are Due and Overdue. Looking at this Dashboard, you may realise that there was a whole lot of stock that was sent back, which hasn’t been adjusted yet by the Supplier. This explains the massive amount sitting in the Older Than 120 Days column.
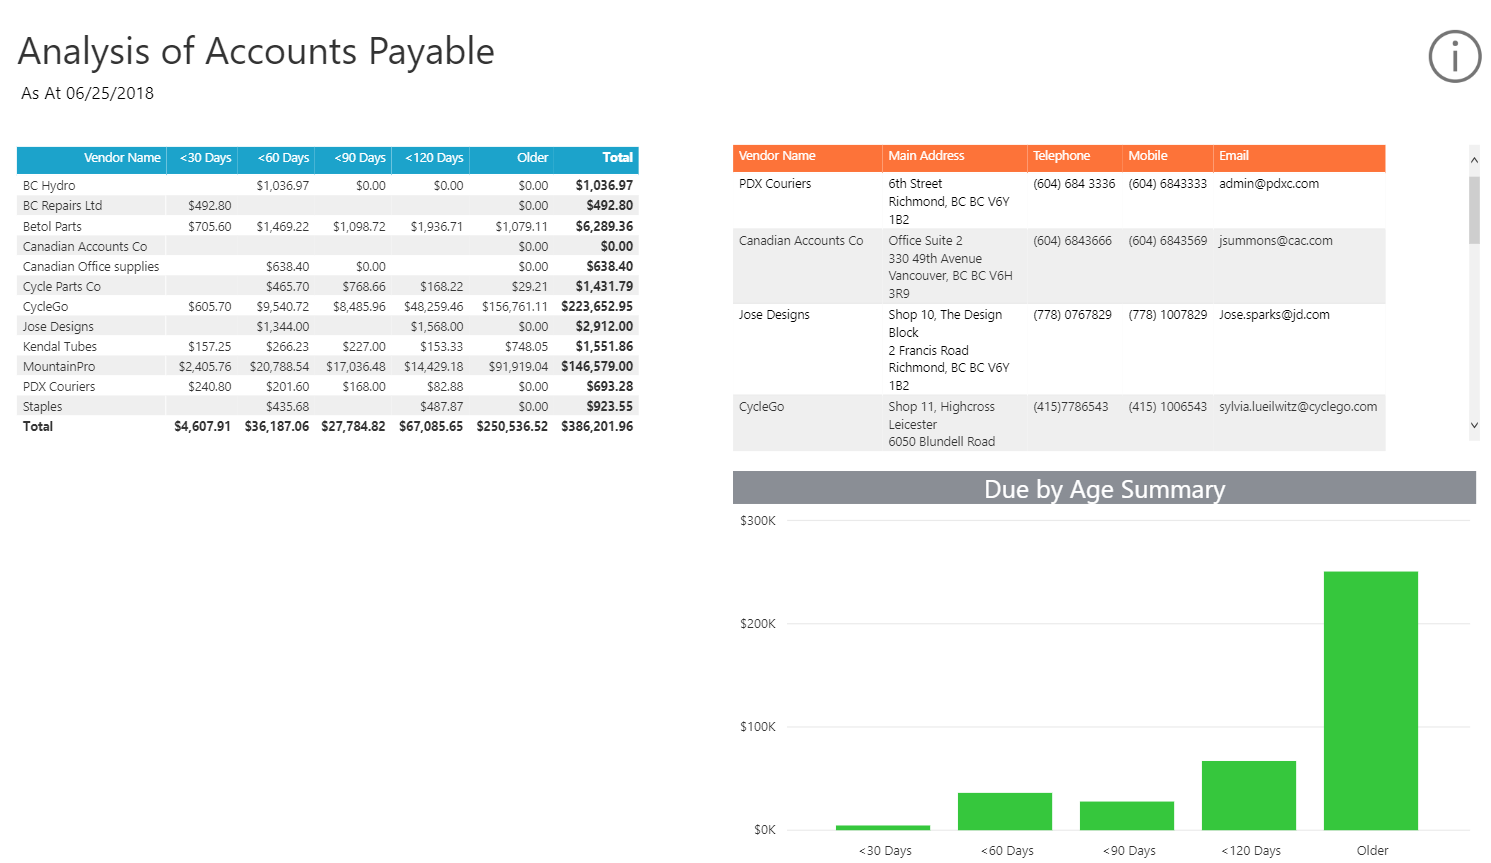
From here, you’re also able to view the specific invoices—so that you can contact CycleGo and find out where your credit notes are. When you click on Detail, you’ll get a summary of your business’s Aged Creditors in a table format.
This sheet is also interactive, and so if you had to click on 60 days, for example, only information allocated to 60 days will show up in the table. All suppliers sitting in 60 days will show up on the right-hand side.
In summary, this report gives you the ability to monitor how long you have owed your creditors money and which ageing category that money is sitting in. By doing this, you can better manage relationships with Creditors by either contacting them to arrange new credit terms, or paying them the amounts due to them.
Get more insights into your information!
Click on the report below that you want to find out more information on, and discover the incredible impact it will have on your business:
- Understand your customers with a Sales Trend Analysis report.
- Get a picture of your business’s health with the Financial Hygiene Dashboard.
- Collect your cash with the Analysis of Accounts Receivable report.
- Track your creditors with the Analysis of Accounts Payable report.
- Know your numbers with the Business Snapshot Dashboard.
Check out how these interactive dashboards can change the way you see your business by logging in to your Sage Accounting solution and trying them out now! For Sage Accounting in the United States, log in here. For Sage Accounting in Canada, log in here.
Want to discover more about where to find Sage Intelligence in your Accounting solution, or do you want to try out an interactive product tour? Check out our main solution page here.
