We all know that cash flow is such an essential ingredient to the survival and success of any business. If you ever encounter cash flow problems at some stage of your business’s life, it could be a serious obstacle to your progress.
Which is why it always pays to keep a close eye on what your cash flow is doing and ensure that you’re in the position to take steps to rectify any problems before things get out of hand.
This Financial Hygiene Dashboard gives you an overview of your cash transactions, both past and into the future, to give you a projection of your bank balance assuming all outstanding cash has been paid and received.
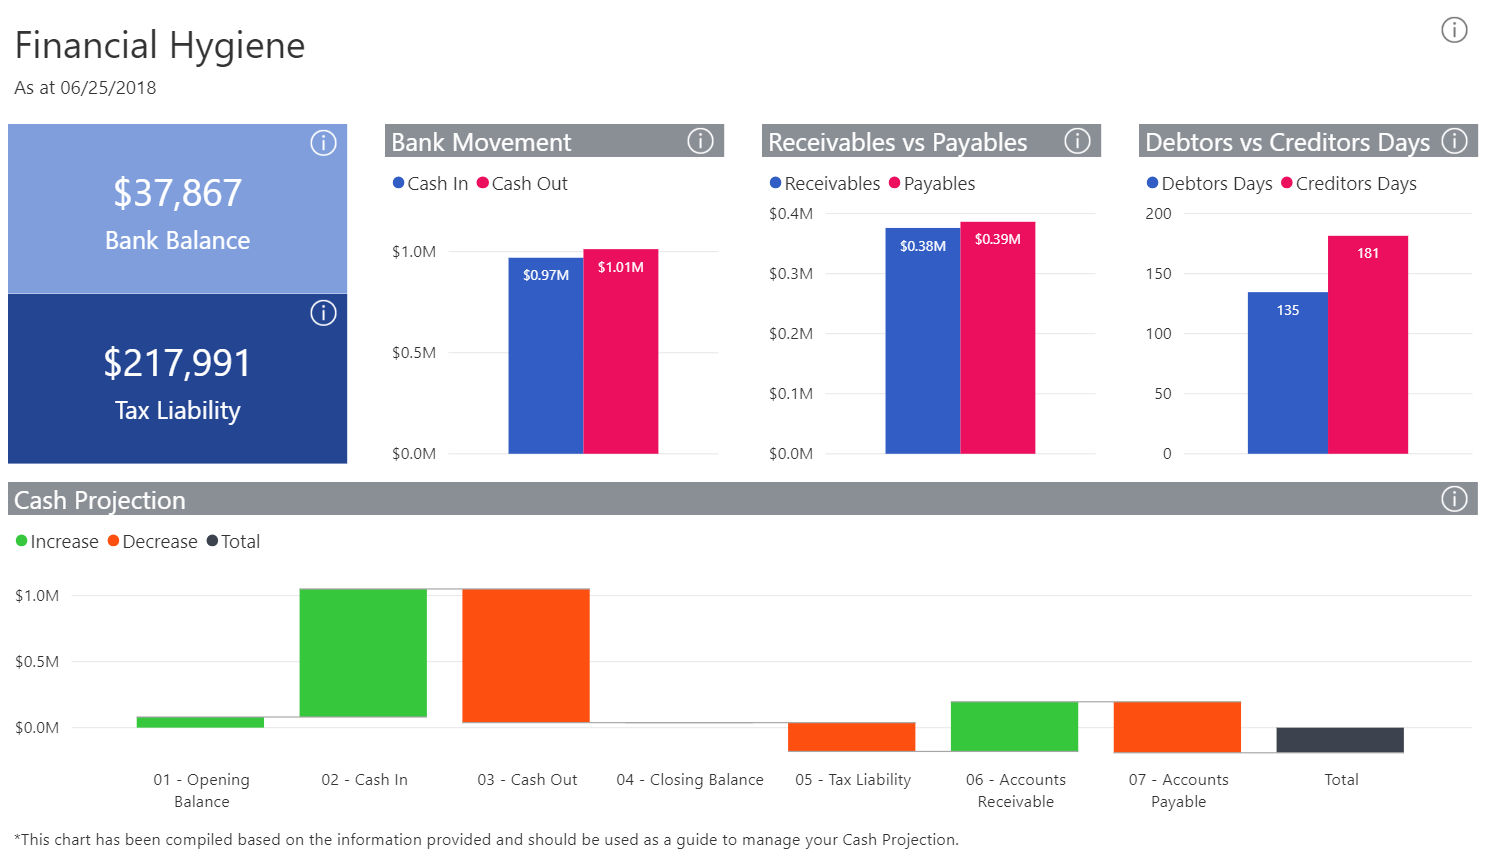
The report starts off by providing your current bank balance for all bank accounts and your current tax liability.
You’re also able to view how much cash you’ve received into your bank account verses how much you’ve paid out. As a business owner, you need to monitor your cash movement closely. For example, if there is more cash going out of your bank account than coming in, alarm bells would be ringing as this could lead to cash flow issues!
Then, under Movement, you’re able to see how much cash you’ve received into your bank verses how much you’ve paid out over the past year. Under Receivables vs Payables, you’re given a view of how much cash is still owed to you by your customers and how you owe to your vendors/suppliers at the current date. Your Bank Balance, Tax Liability, Bank Movement, Receivables and Payables, along with your opening bank balance are then all tied into a Cash Projection, showing your expected bank balance as if your Tax Liability was paid and your Accounts Receivable and Payable were settled.
In addition to this, your debtors days and creditors days is provided. This gives you a measure of how fast your customers are paying you versus how fast you’re paying your vendor/suppliers and gives you an idea of how fast your receivables and payables will be settled. Although you want to ensure that both values are fairly low, if your debtors days exceeds your creditors days, it means you’re paying out money faster than you’re receiving it, which could lead to cash flow problems down the line.
You’re also provided with a Cash Projection for your business in this Dashboard. This is a quick cash flow projection that tells you your bank balance for today (1), how much cash you owe in tax (5), how much you’re due to receive from my Debtors (6), and how much you owe your creditors (7).
Get more insights into your information!
Click on the report below that you want to find out more information on, and discover the incredible impact it will have on your business:
- Understand your customers with a Sales Trend Analysis report.
- Get a picture of your business’s health with the Financial Hygiene Dashboard.
- Collect your cash with the Analysis of Accounts Receivable report.
- Track your creditors with the Analysis of Accounts Payable report.
- Know your numbers with the Business Snapshot Dashboard.
Check out how these interactive dashboards can change the way you see your business by logging in to your Sage Accounting solution and trying them out now! For Sage Accounting in the United States, log in here. For Sage Accounting in Canada, log in here.
Want to discover more about where to find Sage Intelligence in your Accounting solution, or do you want to try out an interactive product tour? Check out our main solution page here.
