It’s important for any business owner to know exactly who owes them cash, how much, and when they can expect to receive it from their customers.
Looking at this Dashboard, the first thing you’ll see is that your Debtors Days are 134.54 and, in the red. This means that on average, your debtors are paying you every 134.54 days compared to the average credit terms of 37.31 days that you have set for your debtors in your business. We’re all aware of the phrase, Cash is King, and this is especially true for a start-up business where money is tight. As a business owner, you need to closely monitor how quickly your debtors are paying you—and for this mission, the colour red is not acceptable.

Looking at the Accounts Receivable Age Summary, you’re able to view how much you’re owed and for how long it’s been outstanding. Straight away, you’ll notice that there is $140k sitting in 120 Days and $76k sitting in Older Than 120 Days—which is cash that’s outstanding and needs to be collected by you. By clicking on 120 Days, the interactive chart shows you that the outstanding amount largely relates to a specific Customer: BMC.
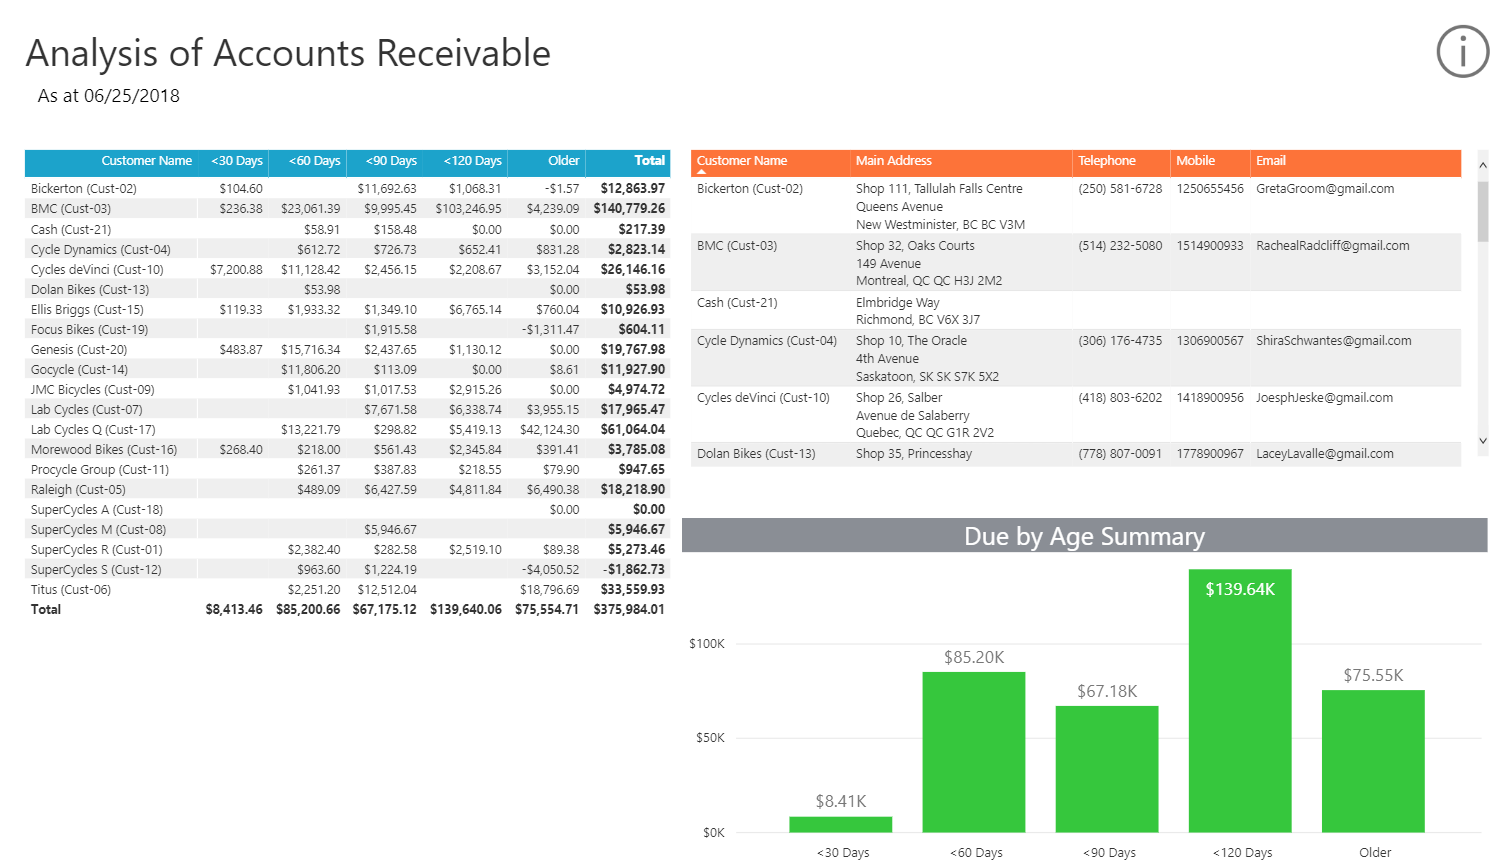
If you then right-click on BMC and click Drill through, you can immediately drill-down to the specific Customer information and follow up with the appropriate person for the outstanding amounts. You’re also able to view what BMC’s average credit terms are, if there are any sales this month to them, and what amounts are due and/or overdue.
To view a summary of your Debtors’ history in a tabular format, you can click on the details tab and get a tabular report that is just as interactive as the Dashboard.
Get more insights into your information!
Click on the report below that you want to find out more information on, and discover the incredible impact it will have on your business:
- Understand your customers with a Sales Trend Analysis report.
- Get a picture of your business’s health with the Financial Hygiene Dashboard.
- Collect your cash with the Analysis of Accounts Receivable report.
- Track your creditors with the Analysis of Accounts Payable report.
- Know your numbers with the Business Snapshot Dashboard.
Check out how these interactive dashboards can change the way you see your business by logging in to your Sage Accounting solution and trying them out now! For Sage Accounting in the United States, log in here. For Sage Accounting in Canada, log in here.
Want to discover more about where to find Sage Intelligence in your Accounting solution, or do you want to try out an interactive product tour? Check out our main solution page here.
