The Business Snapshot Dashboard – Profit and Loss statement provides a visual summary of how your business is doing with regards to generating sales, managing expenses and creating profits. In other words, whether your business has made or lost money in the period under review. This can also help determine trends for future business decisions.
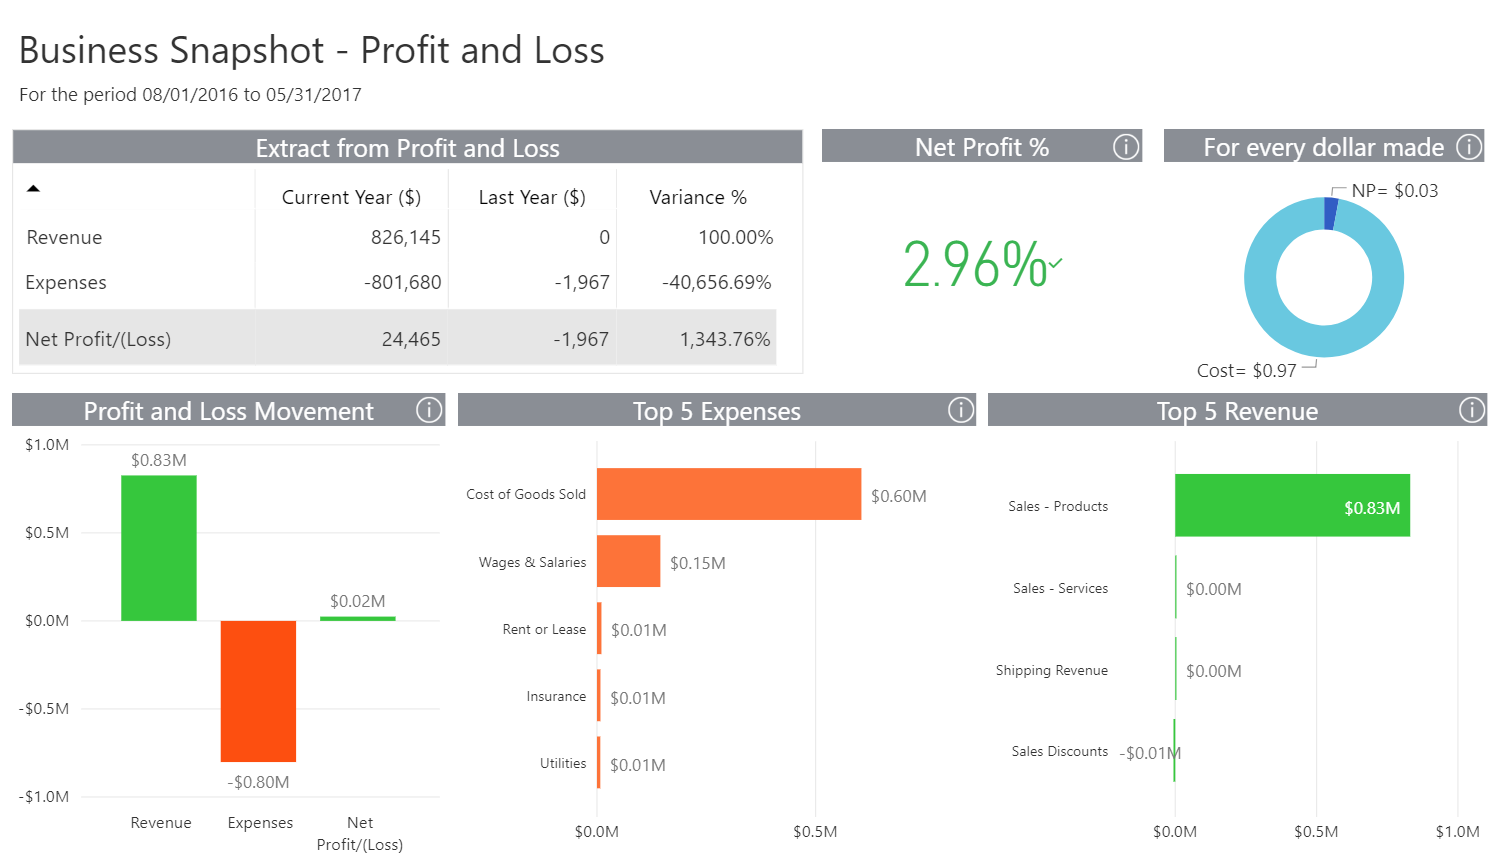
Looking at the extract from the Profit and Loss (P&L) statement, you’re able to view the current year’s P&L compared to last year, as well as the percentage variance. For example, your sales may have $826k, however your expenses are really high ($800K)—which explains why your Net Profit is low, at 3%. You can then investigate further as to why this is so, for example; the cost of every dollar you make is $0.97, while your profit is only $0.03, and so you can investigate further if this was a pricing issue, or if purchases haven’t been correctly adjusted to stock in the balance sheet.
As a business owner, you may also want to see your Top 5 Expenses. From this Dashboard, you can click on the P&L Overheads tab and view a full list of your business expenses compared to last year, as well as the percentage variance.
Checking out the Balance Sheet tab
A balance sheet is a snapshot of what your business owns (assets) and owes (liabilities) at a specific point in time. Your balance sheet is an indicator of the financial health of your business.

We have included specific ratios to help you determine your business’s health. While these may initially seem daunting, we have included a description of what each ratio means. You simply need to click (i) for a detailed explanation.
Get more insights into your information!
Click on the report below that you want to find out more information on, and discover the incredible impact it will have on your business:
- Understand your customers with a Sales Trend Analysis report.
- Get a picture of your business’s health with the Financial Hygiene Dashboard.
- Collect your cash with the Analysis of Accounts Receivable report.
- Track your creditors with the Analysis of Accounts Payable report.
- Know your numbers with the Business Snapshot Dashboard.
Check out how these interactive dashboards can change the way you see your business by logging in to your Sage Accounting solution and trying them out now! For Sage Accounting in the United States, log in here. For Sage Accounting in Canada, log in here.
Want to discover more about where to find Sage Intelligence in your Accounting solution, or do you want to try out an interactive product tour? Check out our main solution page here.
