Do you want to create your own operational report and analyze it according to your specific reporting needs from Accounting International? Sage Intelligence Reporting & Microsoft Excel make this easy and quick to do.
Applies to: Accounting International, Microsoft Excel 2013 & 2016
How do I do this?
1. Download one of the standard Intelligence Sales reports from the Accounting International website here. This will download an Excel workbook.
2. Once finished, open the workbook. You may be asked to enable it for editing. Click Enable Editing.
3. If this is the first time you’re opening a Sage Intelligence for Accounting report, you’ll be asked to accept the add-in in the pane on the right of the workbook. Click Trust this add-in.

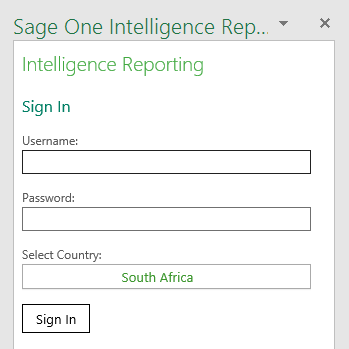
4. The Intelligence Reporting Task Pane will then load and you can sign in with your Accounting login.
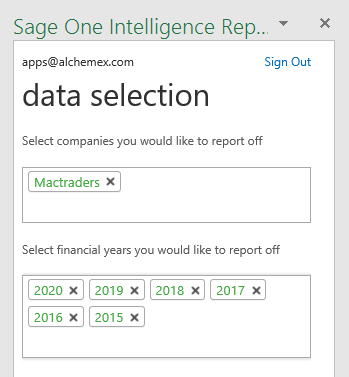
5. Next, select the Company & Financial Years you would like to report on and the click Load.
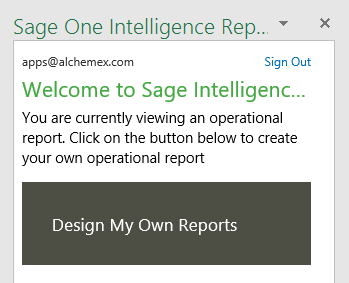
6. Open a new sheet in the workbook (Shift +F11) and then click on Design My Own Reports in the Task Pane.
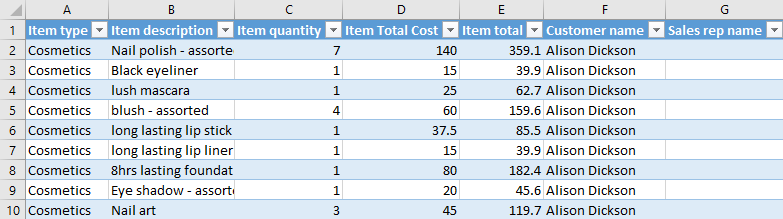
7. Make sure the Operational tab is selected and then pick the relevant options for the choices below:
- The Operational Area you would like to work with, e.g. Sales by Customer.
- The different fields you would like to see, e.g. Customer Name, Item Quantity, etc.
- The date range you would like to report on, e.g. 1 January 2017 to 30 April 2017.
- Add any filters you would like to include, e.g. Item Type equal to Cosmetics.

8. Once finished click Create New Table. This will place the information in a table format in the worksheet.
9. You can now use this to create your report layouts using standard Excel functionality like Pivot Tables and Pivot Charts. Below is an example of one showing the sales for my top ten customers.

If you found this tip useful, why not join our guest list and receive a tip every month that will help you take full advantage of your Sage Intelligence solution?
