- Solutions
All Solutions
- Standalone Reporting Tool
- Sage Intelligence for Accounting
- Sage 300cloud Intelligence
- Sage 50cloud Pastel Intelligence Reporting
- Sage Pastel Payroll Intelligence Reporting
- Sage 100/200 Evolution Intelligence Reporting
- Sage 100 Intelligence Reporting
- Sage 300 Intelligence Reporting
- Sage 500 Intelligence Reporting
- Sage VIP Intelligence Reporting
- Resources
All Solutions
- Standalone Reporting Tool
- Sage Intelligence for Accounting
- Sage 300cloud Intelligence
- Sage 50cloud Pastel Intelligence Reporting
- Sage Pastel Payroll Intelligence Reporting
- Sage 100/200 Evolution Intelligence Reporting
- Sage 100 Intelligence Reporting
- Sage 300 Intelligence Reporting
- Sage 500 Intelligence Reporting
- Sage VIP Intelligence Reporting
Additional Reports
Download our latest Report Utility tool, giving you the ability to access a library of continually updated reports. You don’t need to waste time manually importing new reports, they are automatically imported into the Report Manager module for you to start using.Sage Intelligence Tips & Tricks
Our Sage Intelligence Tips and Tricks will help you make the most of your favorite reporting solution.Excel Tips & Tricks
Our Excel Tips and Tricks will help you improve your business reporting knowledge and skills.Sage Intelligence for AccountingWith Sage Intelligence for Accounting, you get ready-to-use online and Microsoft® Excel® reports that give you immediate insight into and across your business. Take a look at the list of online reports available to you. You can also download any of the Excel reports listed below, sign in with your Accounting credentials and enjoy the flexible reporting capabilities of Excel!
Online ReportsOpen
CloseFinancial reports
Management Pack
An easy way to merge multiple online reports into a single online “workbook”. Each report will be presented as a separate sheet in the report. It can also be downloaded as an Excel workbook for customisation.
Balance Sheet – Actual 1to12
This summary report includes a breakdown of all Assets and Liabilities for the finance year being reported on as well as the balance as at the end of each financial period.
Balance Sheet – Actual 1to12 – Prior 1to12
This report includes a detailed breakdown of all assets and liabilities and their accounts as well as the balance as at the end of each financial period for the finance year being reported on and for the prior finance year.
Balance Sheet – Actual vs Prior 1to12
This summary report includes a breakdown of all assets and liabilities as well as the balance as at the end of each financial period for the finance year being reported on and for the prior finance year.
Profit & Loss – Actual 1to12 – Actual YTD
This report includes a detailed breakdown of the revenue, costs and expenses and related accounts for each financial period within the specified financial year. The report calculates the Gross Profit (or Loss) as well as the Net Profit (or Loss) for each period and can be used to track changes over a set period of time.
Profit & Loss – Actual 1to12-Budget 1to12 – Actual YTD-Budget YTD
This summary report includes a breakdown of the revenue, costs and expenses incurred and budgeted for each financial period within the specified financial year. The report calculates the Gross Profit (or Loss) as well as the Net Profit (or Loss) for each period and can be used to track changes over a set period of time.
Profit & Loss – Actual 1to12-Budget 1to12-Prior 1to12 – Actual YTD-Budget YTD-Prior YTD
This summary report includes a breakdown of the revenue, costs and expenses incurred for each period in the finance year being reported on, the prior finance year and the corresponding budget for each period. The report calculates the Gross Profit (or Loss) as well as the Net Profit (or Loss) for each period in the financial year and can be used to compare the actual profit or loss of a period to what was budgeted.
Profit & Loss – Actual 1to12-Prior 1to12 – Actual YTD-Prior YTD
This detailed report includes a breakdown of the revenue costs and expenses incurred as well as their corresponding accounts for each period in the finance year being reported on and each corresponding period in the prior finance year. The report calculates the Gross Profit (or Loss) as well as the Net Profit (or Loss) for each period in the financial year and can be used to compare the profit and loss of a period to the prior year.
Profit & Loss – Actual-Budget-Prior 1to12 – Actual YTD-Prior YTD & BudgetYTD
This summary report includes a breakdown of the revenue, costs and expenses incurred for each period in the finance year being reported on, the prior finance year and the corresponding budget for each period. The report calculates the Gross Profit (or Loss) as well as the Net Profit (or Loss) for each period in the financial year and can be used to compare the actual profit and loss of a period to what was budgeted.
Profit & Loss – Actual-Budget-Variance 1to12 – Actual YTD-Budget YTD
This summary report includes a breakdown of the revenue, costs and expenses incurred for each period in the finance year being reported on, the corresponding budget and the difference between the actual profit or loss and the budget for each period. The report calculates the Gross Profit (or Loss) as well as the Net Profit (or Loss) for each period in the financial year and can be used to compare the actual profit and loss of a period to what was budgeted.
Profit & Loss – Actual-Prior 1to12 – Actual YTD-Prior YTD
This detailed report includes a breakdown of the revenue, costs and expenses incurred as well as their corresponding accounts for each period in the finance year being reported on and each corresponding period in the prior finance year. The report calculates the Gross Profit (or Loss) as well as the Net Profit (or Loss) for each period in the financial year and can be used to compare the profit and loss of a period to the prior year.
Asset & Liabilities—Actual 1 to 12
This summary report has a breakdown of all Assets and Liabilities for the finance year being reported on as well as the balance as at the end of each financial period.
Assets & Liabilities—Current Month
This summary report has a breakdown of Assets and Liabilities and contains the Opening Balance for the finance year being reported on and the balance as at the end of the current financial period.
Profit and Loss—12 Months Actual vs Prior
The Profit & Loss report summarises the revenue, costs and expenses incurred for each financial period within the specified financial year as well as the same information for the prior year. The report calculates the Gross Profit (or Loss) as well as the Net Profit (or Loss) for each period and can be used to compare changes between prior year and current year for each financial period.
Profit and Loss—12 Months Actuals
The Profit & Loss report summarises the revenue, costs and expenses incurred for each financial period within the specified financial year. The report calculates the Gross Profit (or Loss) as well as the Net Profit (or Loss) for each period and can be used to track changes over a set period of time.
Profit and Loss—Current Period vs YTD
The Profit & Loss report summarises the revenue, costs and expenses incurred for the current financial period for a specified financial year. The Year To Date balance for the current financial period as well as the Year To Date balance taking into account all entries posted is also displayed. The report calculates the Gross Profit (or Loss) as well as the Net Profit (or Loss) for each period.
Assets & Liabilities – Actual 1 to 12
View the closing balances, per account category, for 12 periods in the selected financial year.
Assets & Liabilities — Current Month
View the opening balance for the year and closing balance for the current period in the selected financial year.
Profit and Loss — 12 Months Actual vs Prior
View your actual balances, per account category, for 12 periods in both the selected and prior financial year.
Profit and Loss — Current Period vs YTD
View your actual and actual YTD balances, per account category, for the current period in the selected financial year.
Profit and Loss — 12 Months Actuals
View your actual balances, per account category, for 12 periods in the selected financial year.
Assets & Liabilities – Actual 1 to 12
View the closing balances, per account category, for 12 periods in the selected financial year.
Assets & Liabilities – Current Period
View the opening balance for the year and closing balance for the current period in the selected financial year
Profit and Loss — 12 Months Actual vs Prior
View your actual balances, per account category, for 12 periods in both the selected and prior financial year.
Profit and Loss — Current Period vs YTD
View your actual and actual YTD balances, per account category, for the current period in the selected financial year.
Profit and Loss — 12 Months Actuals
View your actual balances, per account category, for 12 periods in the selected financial year.
Open
CloseDashboards
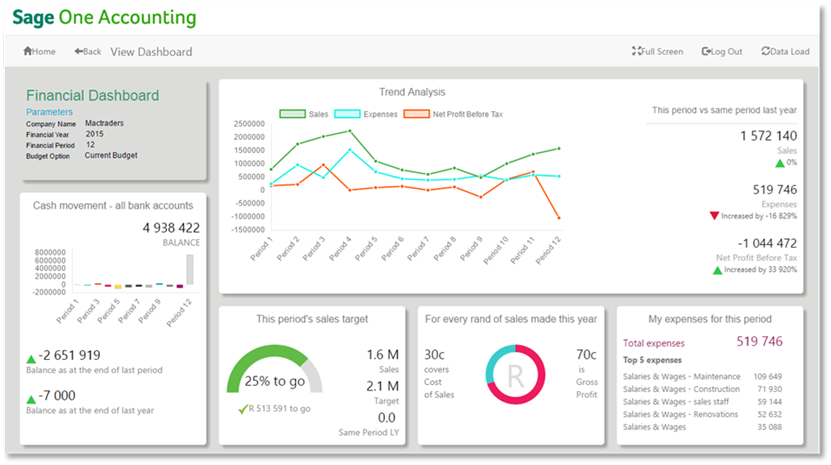
Financial dashboard
This dashboard will help you understand how your business is doing, and in some instances, compares it to the previous financial year. Includes Trend analysis, how far you are with your sales target, gross profit and cost of sales for every Rand of Sales made, top five expenses and cash movement.
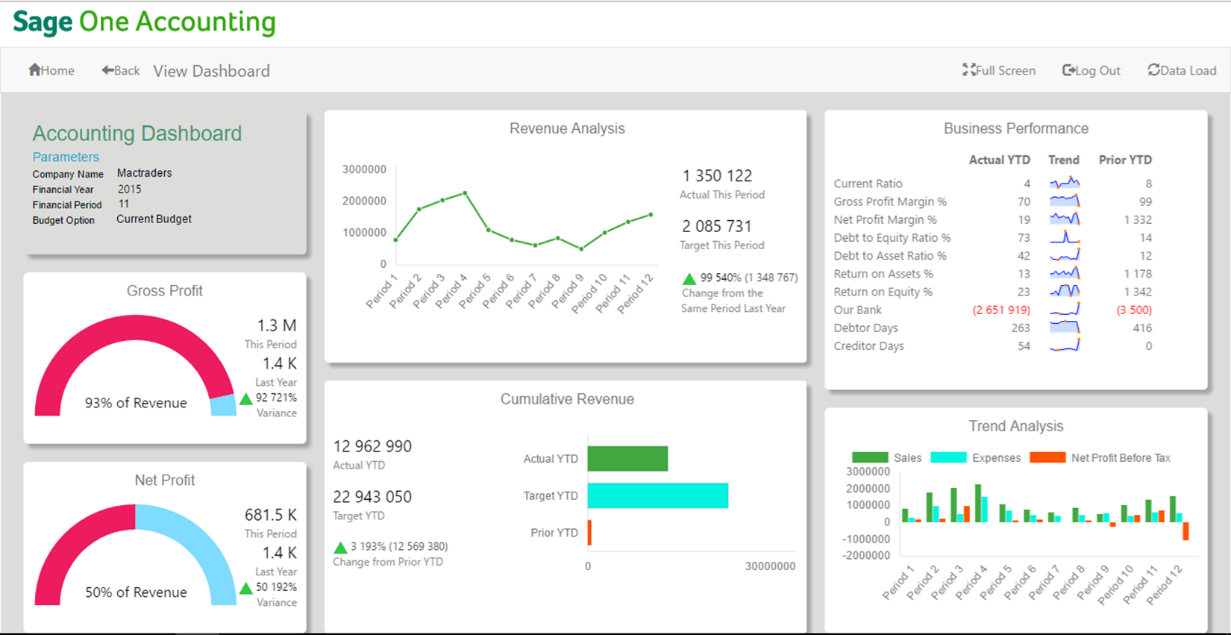
Accounting dashboard
Revenue Analysis, cumulative revenue, trend analysis, ratios, gross and net profit compared to the same period last year.
 Open
Open
CloseInteractive dashboard reports
Analysis of Aged Debtors
View how much you’re owed at any point in time by each of your customers& how long your customers have owed you money for.
Analysis of Aged Creditors
View how much you owe your suppliers at any point in time & how long you’ve owed your suppliers.
Sales Trend Analysis
View your company’s actual sales for a specified period, and historic sales over time.
Business Snapshot
View profit & loss and Balance sheet data, in this comprehensive visualisation.
Financial Hygiene
View & monitor the cash coming into and going out of your business.
Open
CloseInteractive dashboard reports
Analysis of Accounts Receivable
View how much you’re owed at any point in time by each of your customers& how long your customers have owed you money for.
Analysis of Accounts Payable
View how much you owe your suppliers at any point in time & how long you’ve owed your suppliers.
Sales Trend Analysis
View your company’s actual sales for a specified period, and historic sales over time.
Business Snapshot*
View profit & loss and Balance sheet data, in this comprehensive visualisation.
*Please note, this is not available for Accounting Canada customers.
Financial Hygiene
View & monitor the cash coming into and going out of your business.
Excel ReportsOpen
CloseFinancial reports
Profit & Loss Current Month
- Displays calculations for Gross profit, Total Income, Net Profit before Tax, Net Profit after Tax
- Reflects totals per period as well as actual YTD Profit & Loss Annual – YTD
- Handy for long-term financial monitoring and planning
Statement of Assets and Liabilities
Gives you an up-to-date view by period as well as YTD of:
- Current and non-current assets
- Current and non-current liabilities
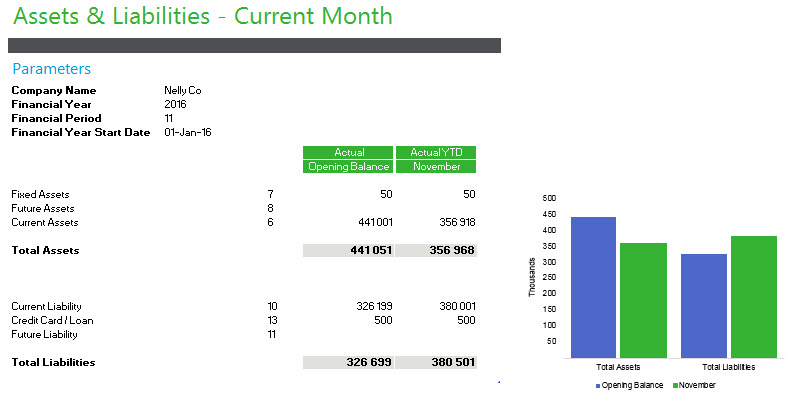
Assets & Liabilities—Current Month & YTD
This summary report has a breakdown of assets and liabilities and contains the opening balance for the finance year being reported on and the balance as at the end of the current financial period. Future period entries have been included in the Year-To-Date column. And, we’ve included a chart which visually displays total assets and total liabilities for each of the above balances.
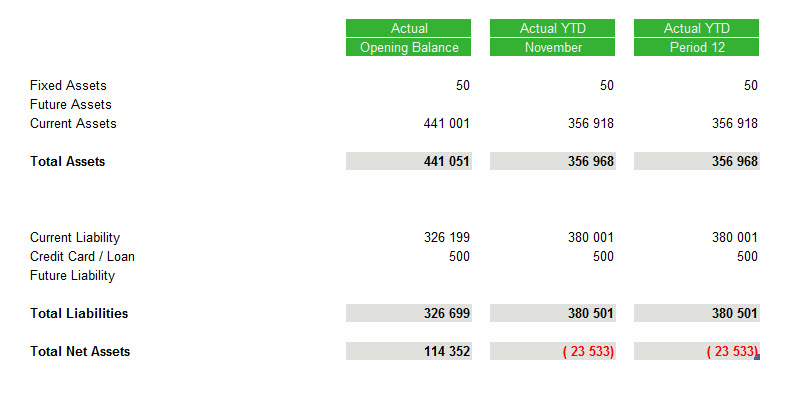
Assets & Liabilities—Opening Balance & Actual 1 – 12
This summary report has a breakdown of all assets and liabilities and contains the opening balance for the finance year being reported on as well as the balance as at the end of each financial period. We’ve also provided a separate layout containing the financial year opening balance and the balance as at the end of the current financial period. And, we’ve included a chart which visually displays total assets and total liabilities for the opening balance and the current period.
Financial Ratio report
The ratio report can be used to analyse your company’s financial standing. You can use it to compare companies across industries to identity strengths and weaknesses. These reports are usually divided into categories, e.g. liquidity, solvency, profitability, so we’ve given you the ability to select a ratio using a slicer which will then display the relevant chart, calculation and description.
Profit & Loss—Actual 1 – 12 & YTD
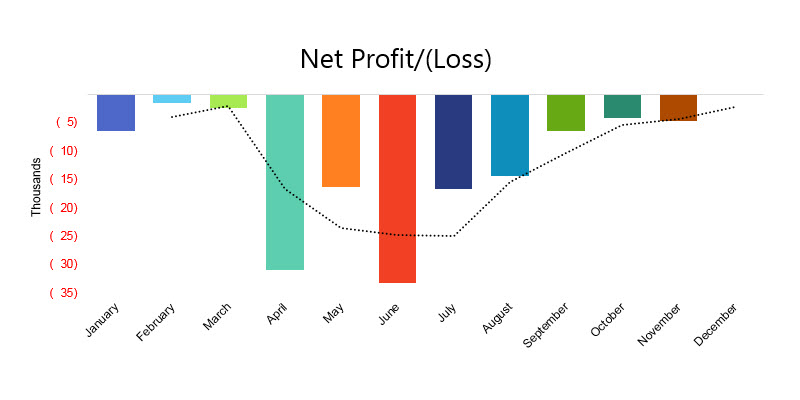
This report summarises the revenue, costs and expenses incurred for each financial period within the specified financial year. The report calculates the Gross Profit (or Loss) as well as the Net Profit (or Loss) for each period and can be used to track changes over a set period of time. The report contains charts to graphically display each financial category of the Profit & Loss statement.
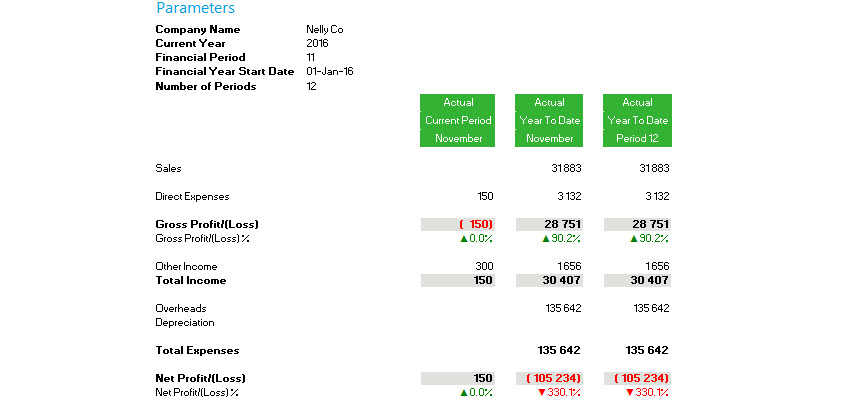
Profit & Loss—Current Period & YTD
This report summarises the revenue, costs and expenses incurred for the current financial period for a specified financial year. It displays the Year To Date balance to the current financial period as well as the Year To Date balance taking into account all entries posted. This report also calculates the Gross Profit (or Loss) as well as the Net Profit (or Loss) for each period.
Trial Balance
This report displays all the debit and credit balances of the ledger per financial group. It has been split into Balance Sheet groups and Income Statement groups, and when added together they should balance. An imbalance would indicate that there is an error. Balances displayed are the opening balance as at the beginning of the specified financial year, the balance for the current financial period, the closing balance as at the end of the current period as well as the balance for all entries posted up to the end of the financial year.
Assets & Liabilities — Opening Balance & Actual 1 – 12
View the opening balance and closing balances, per account category, for 12 periods in the selected financial year.
Assets & Liabilities — Current Period
View the closing balances, per account category, for the current period in the selected financial year
Financial Ratio report
Obtain a quick indication of your company’s financial performance for 12 periods in the selected financial year. The ratio’s are categorized according to the financial aspect of the business which the ratio measures.
Profit & Loss—Actual 1 – 12 & YTD
View your actual & YTD balances, per account category, for 12 periods in the selected year.
Profit & Loss—Current Period & YTD
View your actual balances, per account category, for the current period & YTD in the selected financial year.
Trial Balance
View your actual balances, per account category, for the current period in the selected financial year.
Assets & Liabilities—Opening Balance & Actual 1 – 12
View the opening balance and closing balances, per account category, for 12 periods in the selected financial year.
Assets & Liabilities — Current Month
View the closing balances, per account category, for the current period in the selected financial year
Financial Ratio report
Obtain a quick indication of your company’s financial performance for 12 periods in the selected financial year. The ratio’s are categorized according to the financial aspect of the business which the ratio measures.
Profit & Loss—Actual 1 – 12 & YTD
View your actual & YTD balances, per account category, for 12 periods in the selected year.
Profit & Loss—Current Period & YTD
View your actual balances, per account category, for the current period & YTD in the selected financial year.
Trial Balance
View your actual balances, per account category, for the current period in the selected financial year.
Open
CloseSales reports
Sales Year vs Year Dashboard
Highlights your monthly and yearly sales trends. This report can be sliced by the following:
- Customer
- Company category
- Sales Rep
- Item type
- Calendar month
- Calendar year
Sales Dashboard
Sales patterns:
- Top five customers by sales
- Top five items by sales
- Top five item types by sales
- Top customer categories by customer count
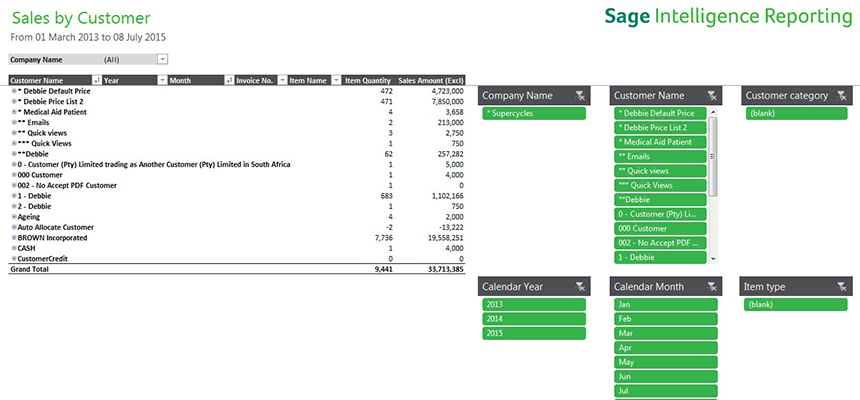
Sales by Customer
Gives you an overview of sales to individual customers including:
- Customer category
- Items types
- Date ranges
 © Sage South Africa Pty Ltd 2020
.
All Rights Reserved.
© Sage South Africa Pty Ltd 2020
.
All Rights Reserved.
-
 Menu
Menu
 Close
Close