When using the SUMIF function between workbooks, you may get a VALUE error if the source workbook is not open. This behavior occurs when the formula that contains the SUMIF, COUNTIF, or COUNTBLANK function refers to cells in a closed workbook. To work around this, use a combination of the SUM and IF functions together […]
- Solutions
All Solutions
- Sage Intelligence for Accounting
- Sage 300cloud Intelligence
- Sage 50 U.S Intelligence Reporting
- Sage 50cloud Pastel Intelligence Reporting
- Sage Pastel Payroll Intelligence Reporting
- Sage 100/200 Evolution Intelligence Reporting
- Sage 100 Intelligence Reporting
- Sage 300 Intelligence Reporting
- Sage 500 Intelligence Reporting
- Sage VIP Intelligence Reporting
- Resources
All Solutions
- Sage Intelligence for Accounting
- Sage 300cloud Intelligence
- Sage 50 U.S Intelligence Reporting
- Sage 50cloud Pastel Intelligence Reporting
- Sage Pastel Payroll Intelligence Reporting
- Sage 100/200 Evolution Intelligence Reporting
- Sage 100 Intelligence Reporting
- Sage 300 Intelligence Reporting
- Sage 500 Intelligence Reporting
- Sage VIP Intelligence Reporting
Additional Reports
Download our latest Report Utility tool, giving you the ability to access a library of continually updated reports. You don’t need to waste time manually importing new reports, they are automatically imported into the Report Manager module for you to start using.Sage Intelligence Tips & Tricks
Our Sage Intelligence Tips and Tricks will help you make the most of your favorite reporting solution.Excel Tips & Tricks
Our Excel Tips and Tricks will help you improve your business reporting knowledge and skills.- Learning
- Support
All Solutions
- Sage Intelligence for Accounting
- Sage 300cloud Intelligence
- Sage 50 U.S Intelligence Reporting
- Sage 50cloud Pastel Intelligence Reporting
- Sage Pastel Payroll Intelligence Reporting
- Sage 100/200 Evolution Intelligence Reporting
- Sage 100 Intelligence Reporting
- Sage 300 Intelligence Reporting
- Sage 500 Intelligence Reporting
- Sage VIP Intelligence Reporting
Additional Reports
Download our latest Report Utility tool, giving you the ability to access a library of continually updated reports. You don’t need to waste time manually importing new reports, they are automatically imported into the Report Manager module for you to start using.Sage Intelligence Tips & Tricks
Our Sage Intelligence Tips and Tricks will help you make the most of your favorite reporting solution.Excel Tips & Tricks
Our Excel Tips and Tricks will help you improve your business reporting knowledge and skills.Get Support Assistance
Can’t find the solution to the challenge you’re facing in the resource library? No problem! Our highly-trained support team are here to help you out.Knowledgebase
Did you know that you also have access to the same knowledgebase articles our colleagues use here at Sage Intelligence? Available 24/7, the Sage Intelligence Knowledgebase gives you access to articles written and updated by Sage support analysts.Report Writers
Having some trouble creating or customizing the exact report you need to suit your business’s requirements? Contact one of the expert report writers recommended by Sage Intelligence.- Sage City
- University
- About Us
- Contact Us
Home Excel 2016 Page 4
How to delete data but keep your formulas on a worksheet in Excel
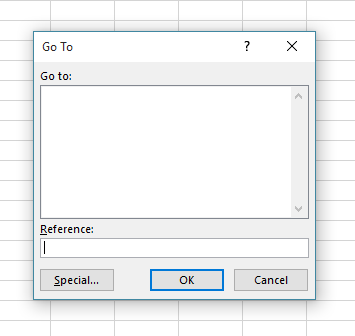
Have you ever found that at the beginning of the financial year you need to make a copy of the previous year’s workbook? If so, you’d need to delete all the old year’s data, but you would really like to keep your formulas in the worksheet. By using the Go To dialogue box, there is […]
How to quickly convert negative values to positive values
Sometimes converting negative values to positive values can be time-consuming. This tip allows you to quickly convert a range of negative values into positive values, without having to edit each cell. Applies To: Microsoft® Excel® for Windows 2010, 2013, and 2016. 1. In a blank cell, enter the value -1. 2. Select the cell with […]
How to round a number off to the nearest multiple in Excel
If you need to round a number off to a specified multiple, for example; rounding a selling price to the nearest 5cents or rounding a time to the nearest 15 minutes—then MROUND is the function to use. Below we explain how that can be done. Applies To: Microsoft® Excel® for Windows 2010,2013,2016 If you want to […]
How to Print a List of Named Ranges in Excel
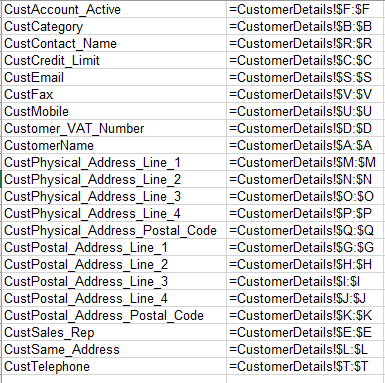
It is very easy to create a large list of named ranges but to manage those ranges can be confusing, especially if you receive the workbook from somebody else. Having a list of the named ranges in your workbook could be helpful. To get a list, follow these steps: Applies To: Microsoft® Excel® for Windows […]
How to Create a 3D Map in Excel 2016
With a 3D Map, you can plot geographical data and view it on a 3D globe or custom map. If your data is time-stamped, you can even use a 3D Map to get a geographical tour of how your data changes over time. To create a 3D Map, your data must be in table format, […]
3 PivotTable Improvements in Microsoft Excel 2016
The PivotTable is one of the easiest tools used to transform huge amounts of data into meaningful reports. Excel didn’t disappoint with the improvements that have been made to PivotTables in their 2016 version. These include the following; Field List search, Automatic Time Grouping, and Multi-select Slicers. In this tip, we explore some improvements made […]
3 Easy steps to create a forecast report in Microsoft® Excel® 2016
Have you ever needed to create a forecast report in Microsoft® Excel®? How did you calculate the projections? Whichever methods you used, Microsoft has made this much simpler with a new feature called Forecast Sheet. All you need to do is provide the input, and with a single click of the new Forecast Sheet button, Excel […]
How to enhance your Excel dashboards with Power View reports
Dashboards in Microsoft® Excel® are used for visually presenting important business information. Dashboards can display current status of metrics and key performance indicators. In this tip, we look at how to enhance dashboards with a Power View report by analyzing sales data. Power View reports in Microsoft® Excel® pull your data together in tables, matrices, […]
How to create a Tree Map chart in Excel 2016
The Tree Map chart is a new chart type available in Microsoft® Excel® 2016. It’s used to proportionally display hierarchical levels of data in the form of different sized rectangle blocks. A sales manager can use the Tree Map chart to monitor the performance of the sales consultants. This chart would be best suited to […]
Return to topLearning
Sage South Africa © Sage South Africa Pty Ltd 2020
.
All Rights Reserved.


