Dashboards in Microsoft® Excel® are used for visually presenting important business information. Dashboards can display current status of metrics and key performance indicators.
In this tip, we look at how to enhance dashboards with a Power View report by analyzing sales data. Power View reports in Microsoft® Excel® pull your data together in tables, matrices, maps, and a variety of charts in an interactive view that brings your data to life.
For every visualization you want to create, you start with a table, which you then easily convert to other visualizations to find one which best illustrates your data.
You are welcome to download the workbook to practice.
Applies To: Microsoft® Excel® 2013 and 2016.
- Select cell A2 and Press Ctrl + A.
- On the Insert tab, in the Reports group, select Power View.
- Create a new Power View sheet.
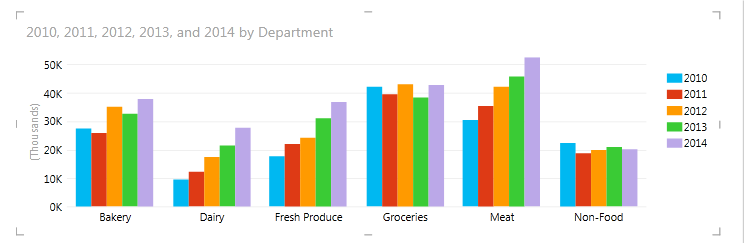
Create a Clustered Chart
- With the table selected, on the Design tab in the Column Chart list, select Clustered Column.
- Drag the right side of the chart to fill the width of the window.
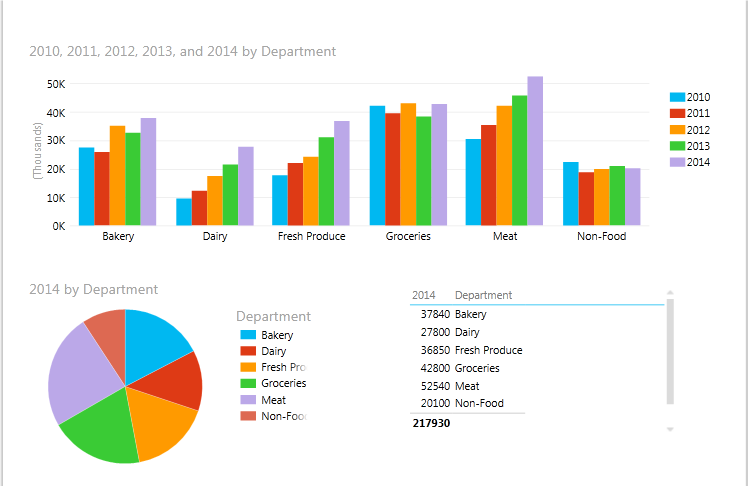
Create a Pie Chart to show the 2014 sales
- Copy the chart and paste it underneath the first one.
- Select the second chart.
- On the Design tab in the Other Chart list, select Pie.
- Reduce the chart to a quarter size of the screen.
- In the Power View Fields, select only 2014 and Department.
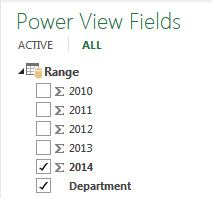
Create a Table showing the 2014 values.
- Copy the chart and paste it next to the first one.
- In the Power View Fields, deselect all of the fields and then reselect 2014 and Department. This will create a table with the values.
- Move the table into position.
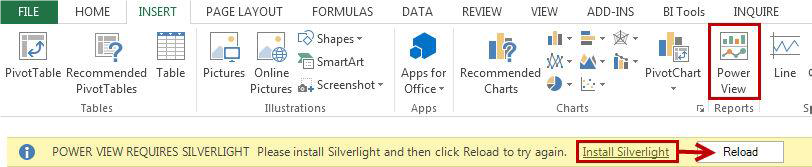
N.B: The first time you insert a Power View worksheet, Microsoft Excel asks you to enable the Power View add-in if it is not installed.
- Select the range of cells containing the data you want to visualize.
- On the Insert tab, in the Reports group, Select Power View, then Enable.
- Click Install Silverlight. Silverlight is a free plug-in program that enables Power View reports.
- After you have followed the steps for installing Silverlight, in Excel, click Reload.
Power view reports enhance dashboards by presenting the summarized data in one view. By using a dashboard such as this one, you can quickly and easily recognize trends, do comparisons, and review performance indicators that will lead to informed decision-making.
