Over the past year we’ve created a number of financial and sales reports, allowing you to get a handle on the financial position of your business and be able to keep track of your creditors and debtors. We’ve made these reports freely available to you through our Report Utility.
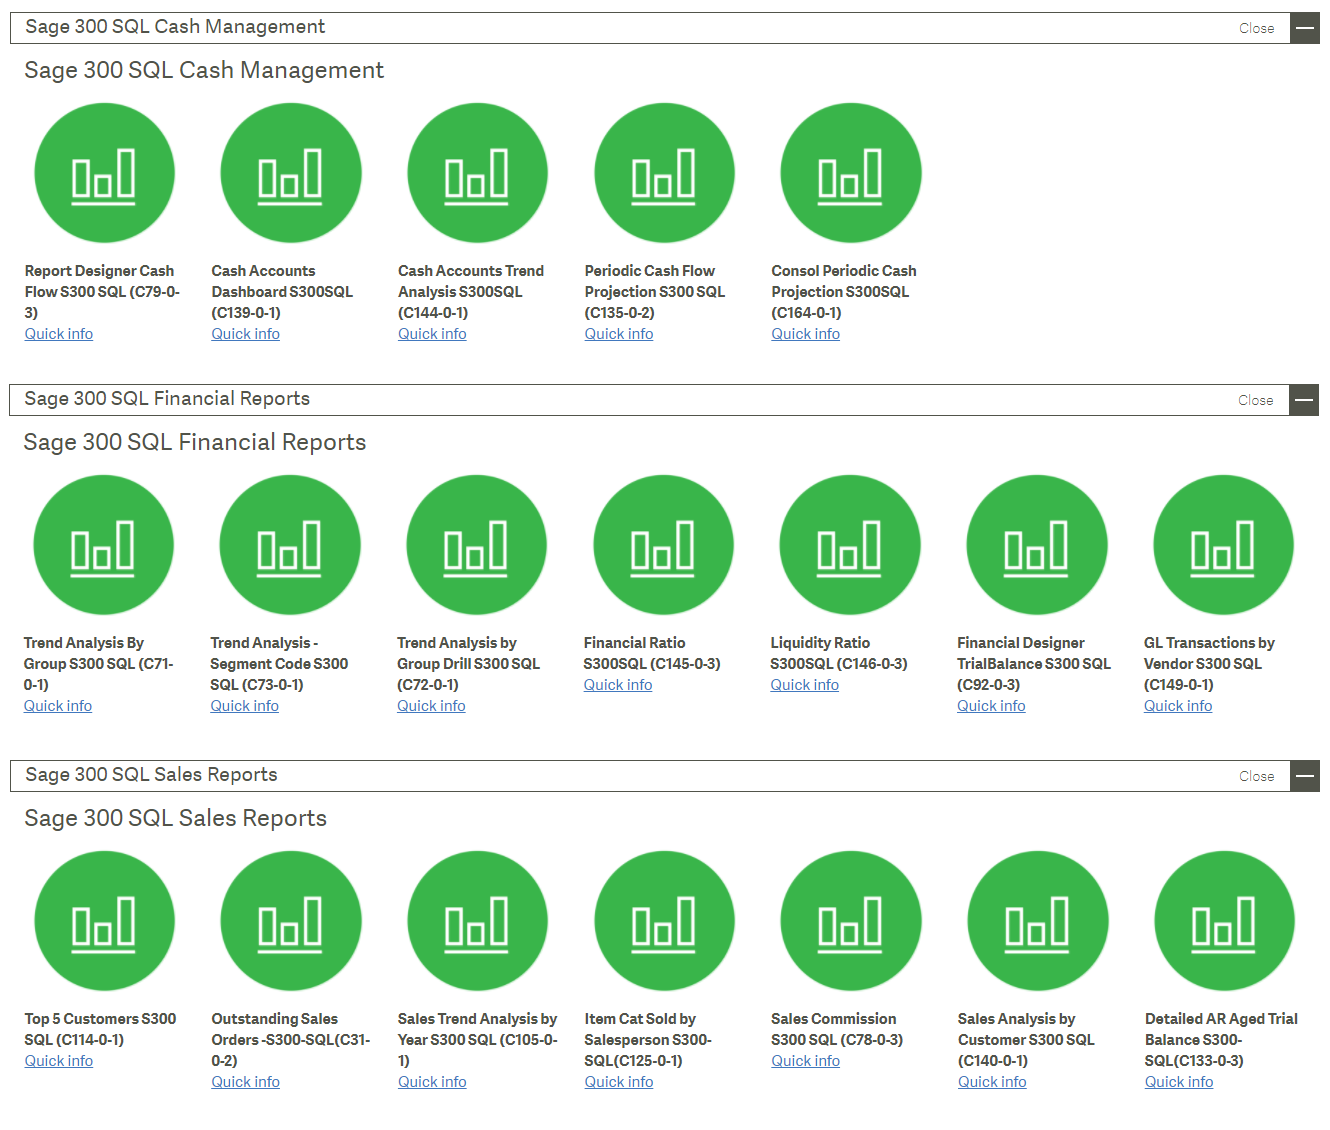
Below is an example of just some of the reports we have under the Cash Management, Financial and Sales sections for Sage 300 Intelligence.
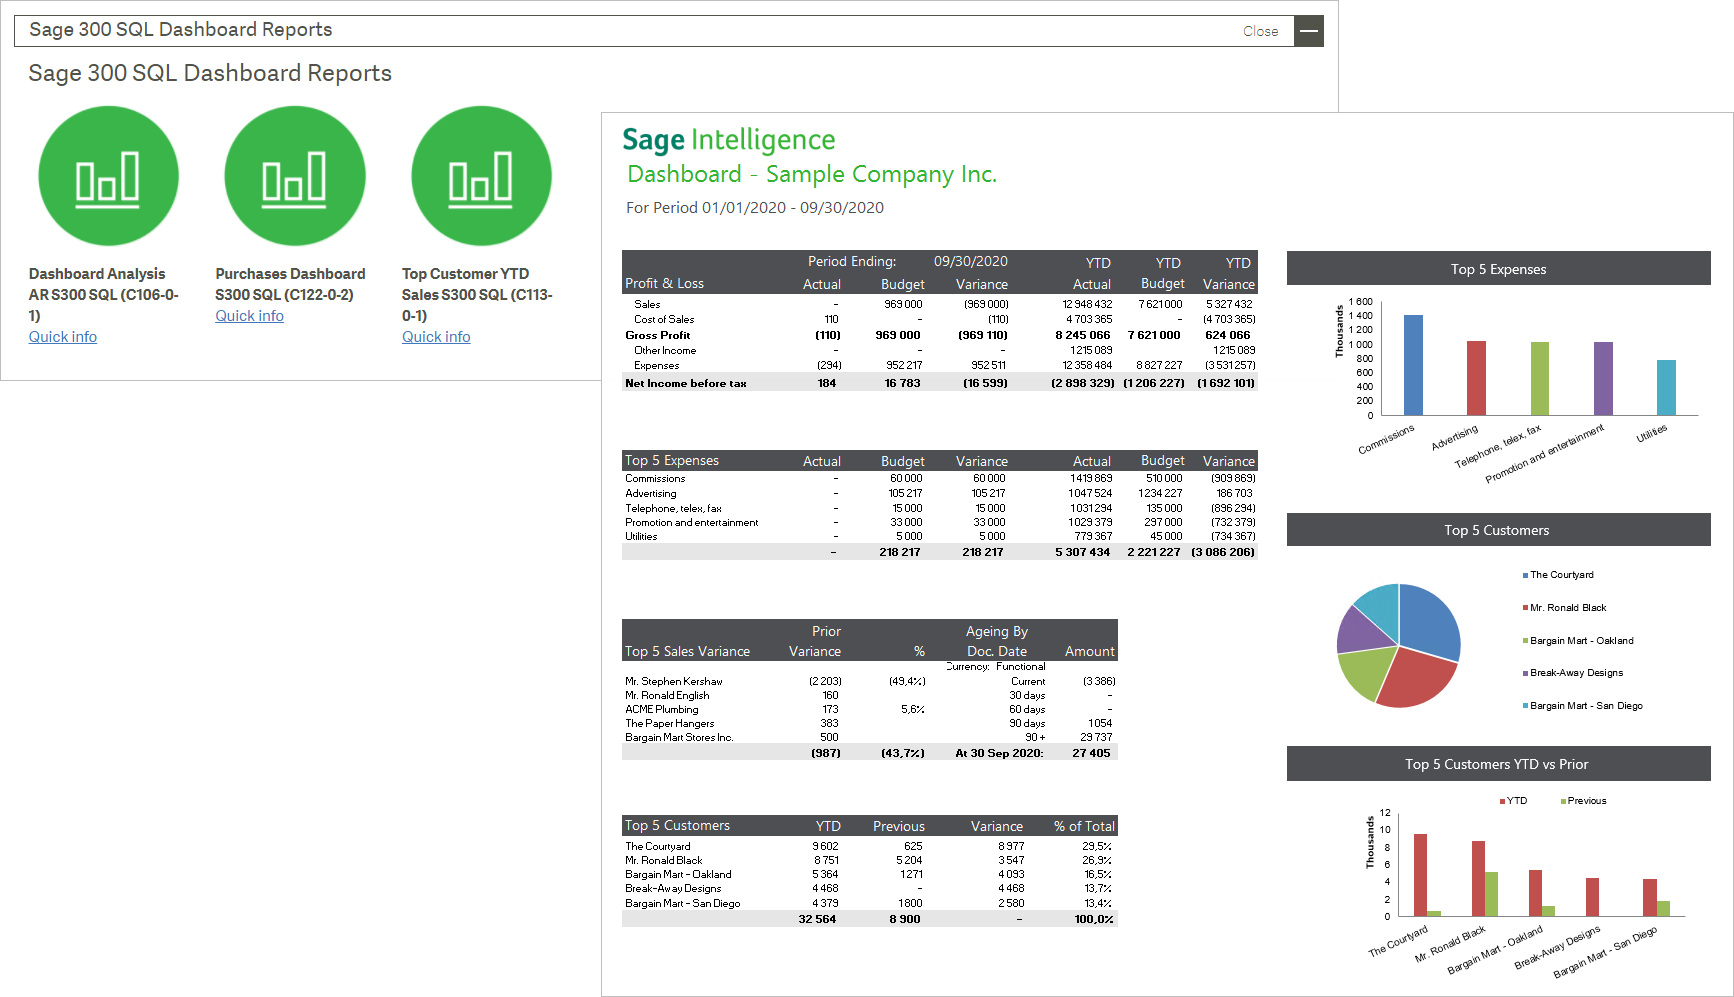
Now in addition to this, we have combined the information from some of these reports in the form of a dashboard, to give you a one-stop overview and health-check of your business. You can now access the key indicators you need quickly and in one place, saving you time and effort. Below is an example of the dashboard reports available for Sage 300 with a view of the Dashboard Analysis report.
To view the available reports for your Sage product, download the Utility, and get your hands on the reports you want, take a look at the Additional Reports page on our website.
Check out our Additional Reports here.
Also, take a moment to check out the nifty video we’ve added to the page, further explaining the benefits that the Utility provides to you. And keep in mind that the reports shown here are just a handful of those available. We also have others dealing with functions like Inventory, Project and Job Costing, and Vendor Management.
