Most successful businesses use a Sales Trend Analysis to report on and predict sales performance. As a small business, knowledge of this information is power! Being able to view and track Sales Trends year-on-year, as well as sales per sales representative, means that you’re kept up to date and empowered to use this information to track performance.
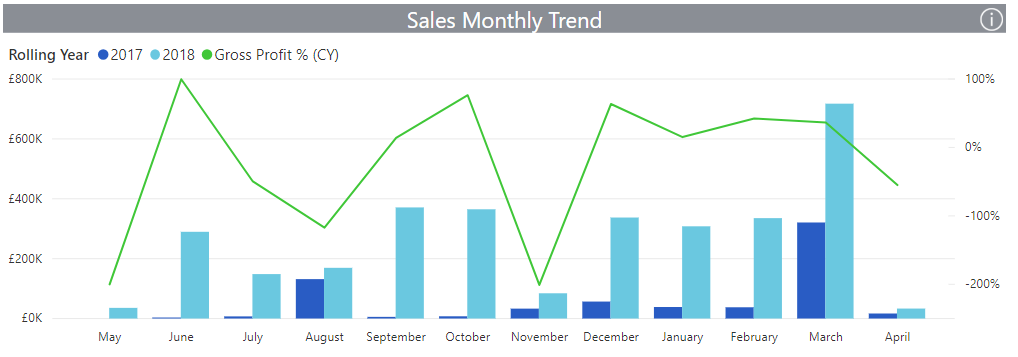
Because this Dashboard is all about a sales trend analysis, it’s prepared off a rolling 12-month period. At a glance, you can immediately see that sales for the current 12-month period is GBP3.2m—which is 387 percent up on the same period last year! As a business owner, seeing the drastic sales increase from last year to this year reveals that your business is growing fast!
Your Gross Profit of GBP765.6k (Current Year) also reveals an increase by 23 percent from the last year—showing that even though sales have increased, you’ve been able to manage your direct expenses. A high Gross Profit means that your business will have more money to pay overheads, like salaries, utilities, and rent.
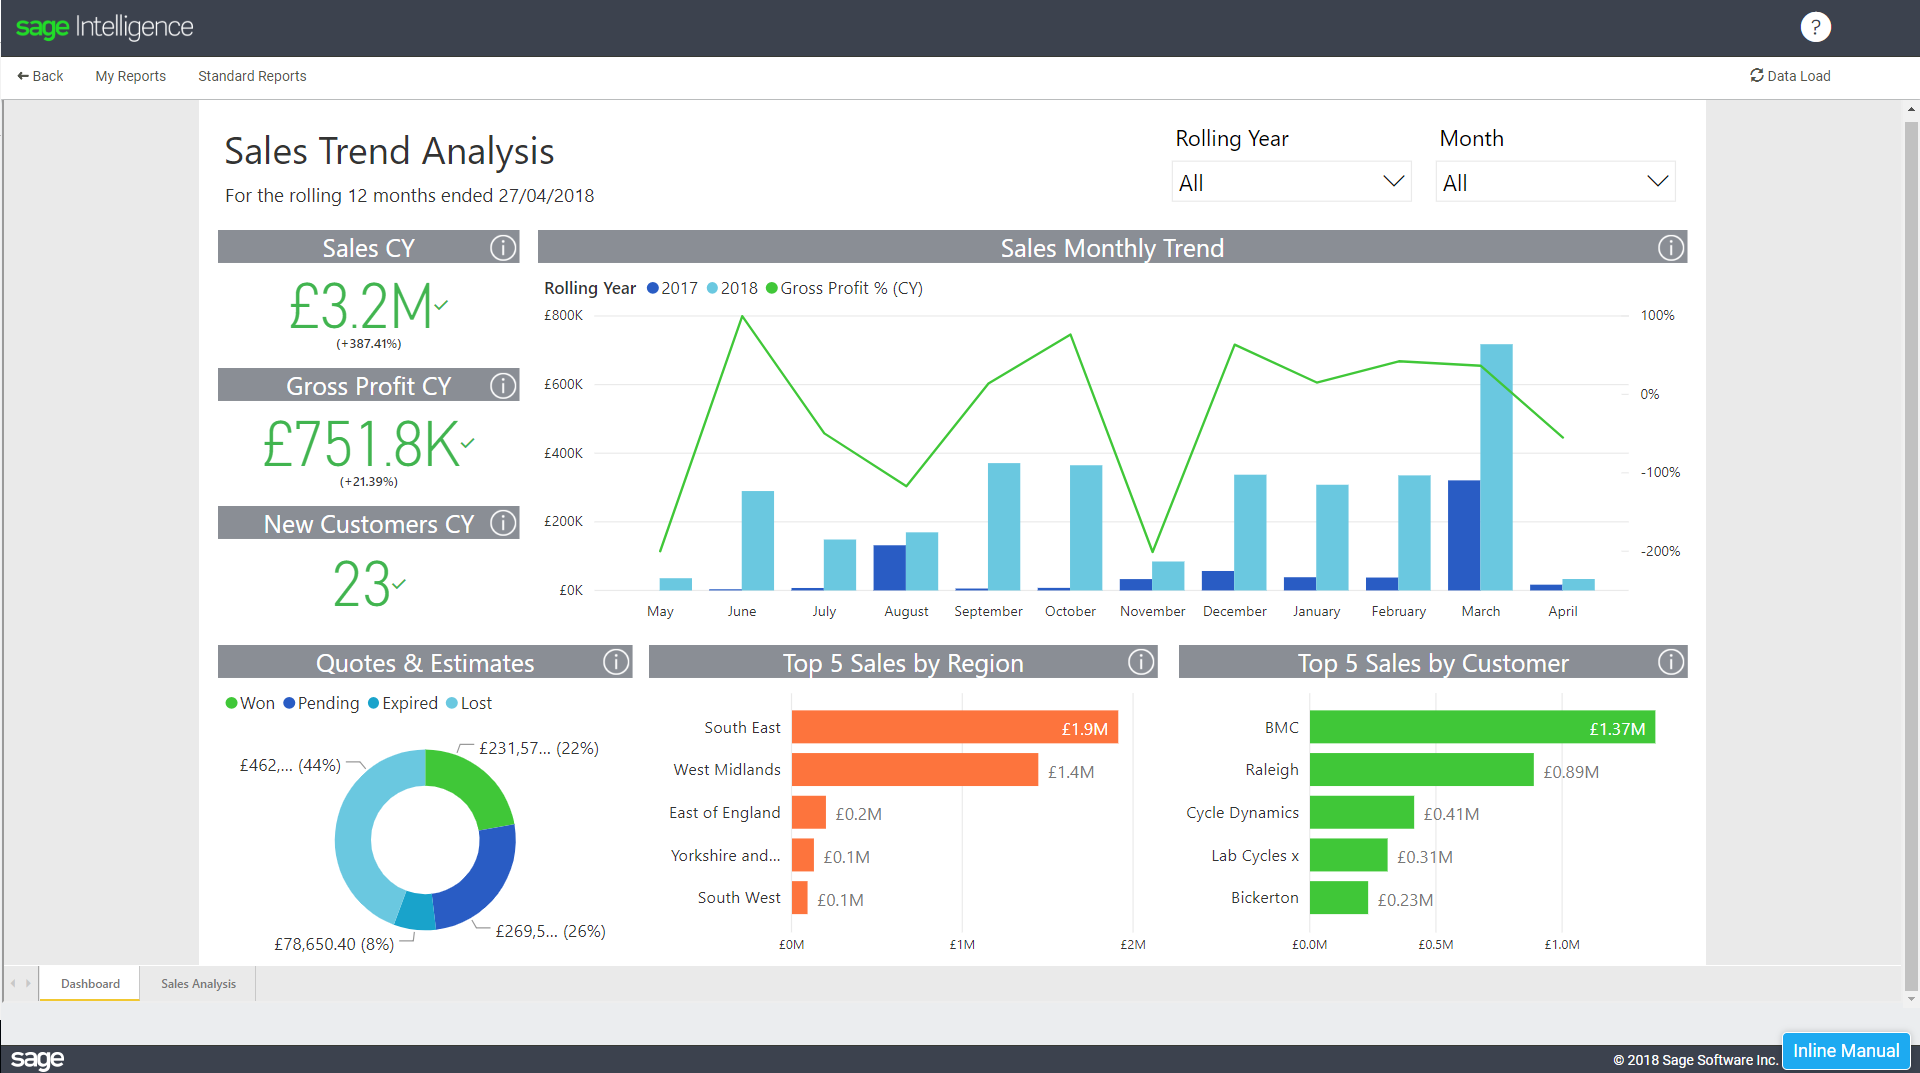
It’s not all good news though. One thing that may be sticking out for you is that the sales for April are extremely low, which is a concern.
With 3 working days still to go until the end of the month, let’s see what you can do to turn this around. If your eye is automatically drawn to the Quotes and Estimates chart, you’re already on the right track. Here you’re able to drill down a level on any pending quotes.

You immediately notice that there are two pending deals for Cycle Dynamics. Given that you have a great relationship with them and that they are one of your Top 5 Customers, you decide that you’re going to quickly drill down a level to get the appropriate details from Cycle Dynamics to give them a call. You’re then empowered to try and close these deals before month end.

Let’s say you’re able to close the outstanding deals, this will make Cycle Dynamics your 2nd highest Sales by Customer. Now you’re more aware that you should look after this client for future sales.

To learn more about this report and how to make best make use of it, watch this short learning video.
Get more insights into your information!
Did you know that we’ve introduced FIVE interactive dashboard reports just like this to Sage Intelligence for Accounting? Click on the report below that you want to find out more information on, and discover the incredible impact it will have on your business:
- Understand your customers with a Sales Trend Analysis report.
- Get a picture of your business’s health with the Financial Hygiene Dashboard.
- Collect your cash with the Analysis of Aged Debtors report.
- Track your creditors with the Analysis of Aged Creditors report.
- Know your numbers with the Business Snapshot Dashboard.
Check out how these interactive dashboards can change the way you see your business by logging in to your Sage Accounting solution and trying them out now!
