The Business Snapshot Dashboard – Profit and Loss statement provides a visual summary of how your business is doing with regards to generating sales, managing expenses and creating profits. In other words, whether your business has made or lost money in the period under review. This can also help determine trends for future business decisions.
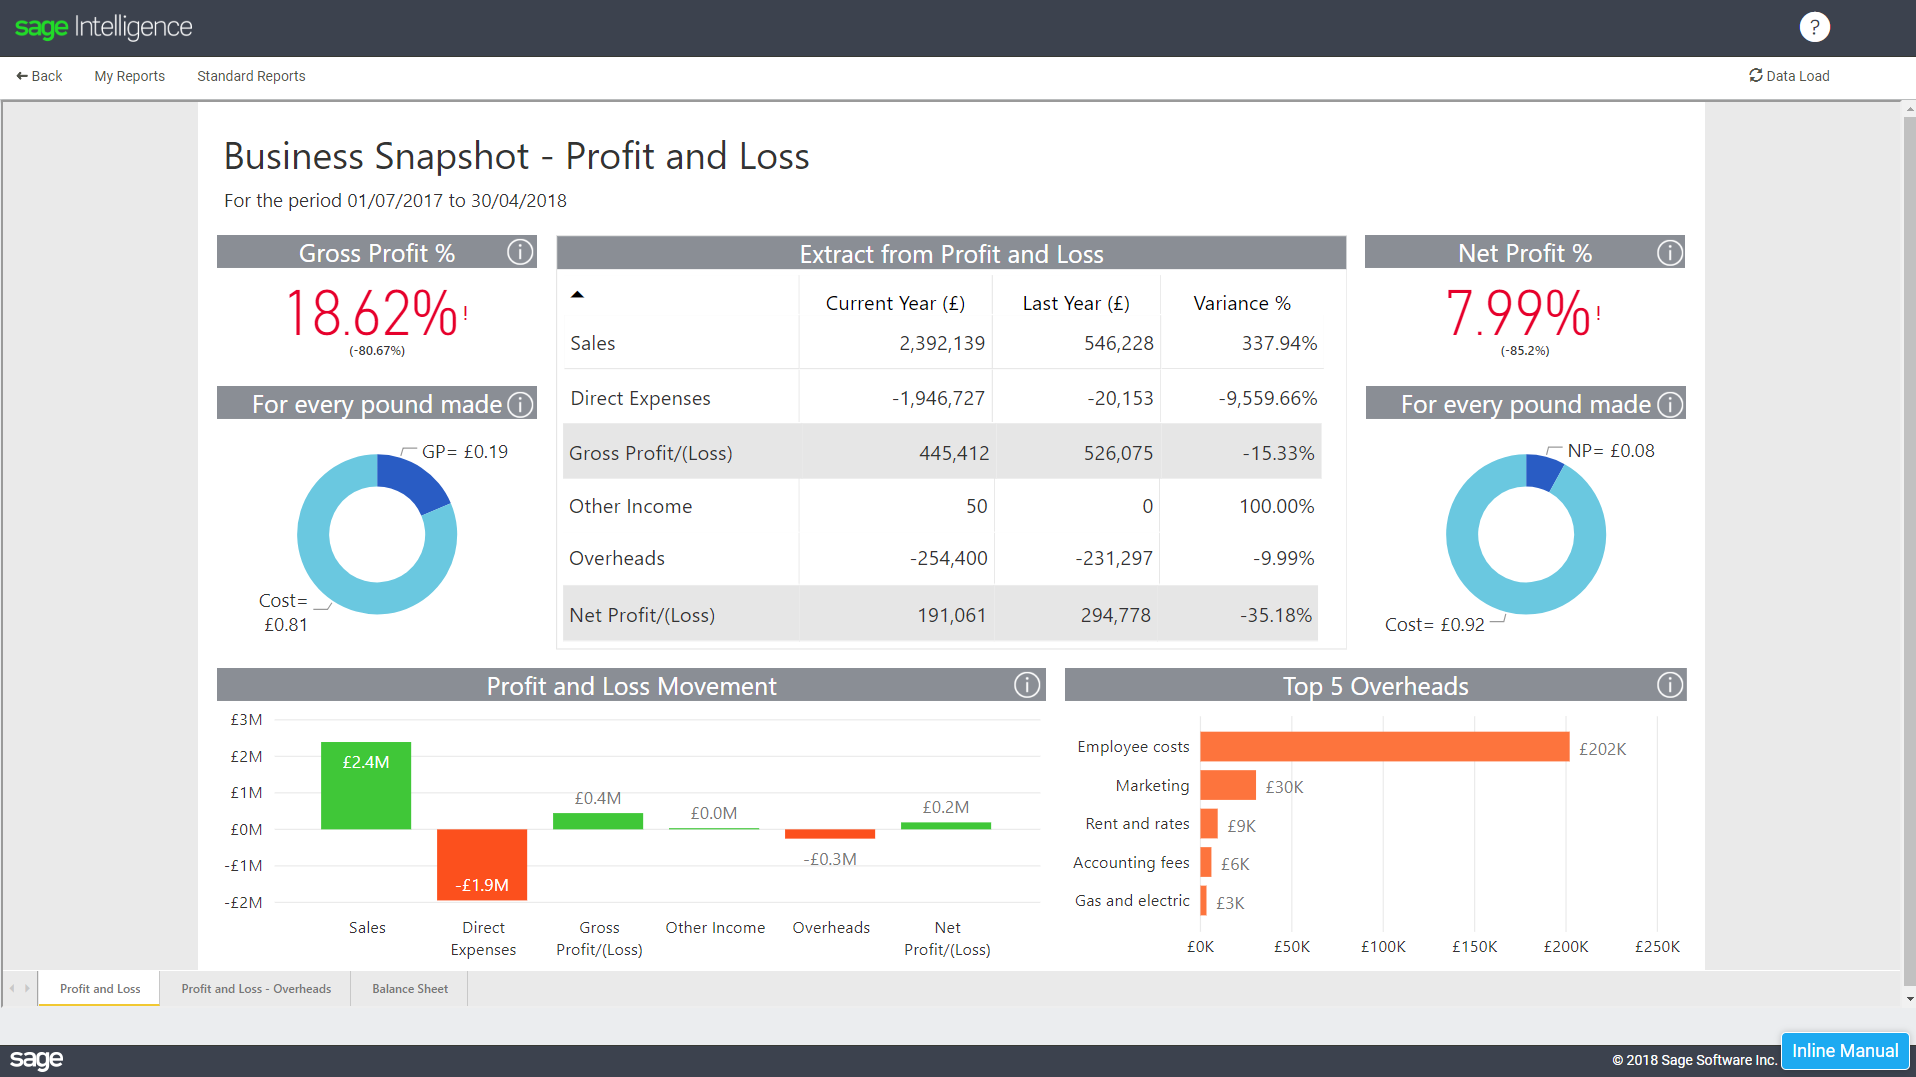
As a business owner, two things would immediately be flagged when looking at this Dashboard:
- Gross Profit percentage (GP%) is down (in red) compared to the prior year. What does this mean for your business? Is your mark up on products or services too low? These are questions you may want to ask yourself from this visual. However, it’s clear from this that for every pound made this year from sales, GBP0.81 went to the cost of that sale, while the remaining GBP0.19 is what was left as Gross Profit.

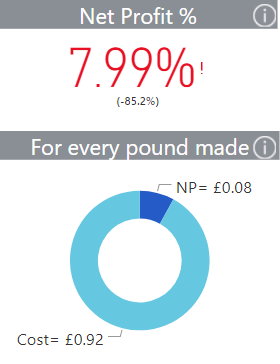
- The second thing that’s flagged is that the Net Profit percentage is also worse off than in the prior year. Again, you may want to ask yourself what this means for your business? This is showing you that for every pound made this year from sales, GBP0.92 is spent on direct expenses (as per GP%) and other expenses for running the business, for example; employee costs and rent. GBP0.08 is then remaining as your actual Net Profit.
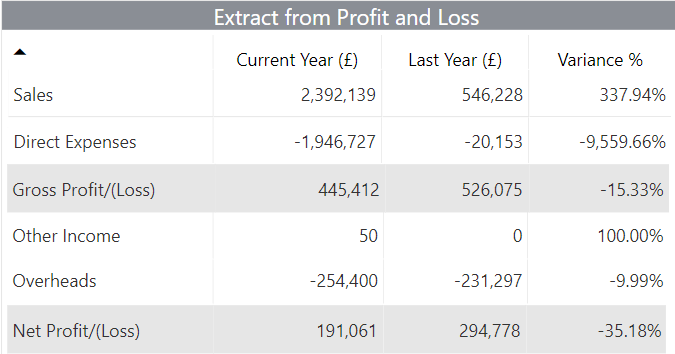
Looking at the extract from the Profit and Loss (P&L) statement, you’re able to view the current year’s P&L compared to last year, as well as the percentage variance. For example, your sales may have increased by 338 percent on last year, however your GP% variance is -15.33%. You can then investigate further as to why the GP% is in negative, for example; the direct expenses look really high, and so you can investigate further if this was a pricing issue or if purchases haven’t been correctly adjusted to stock in the balance sheet.
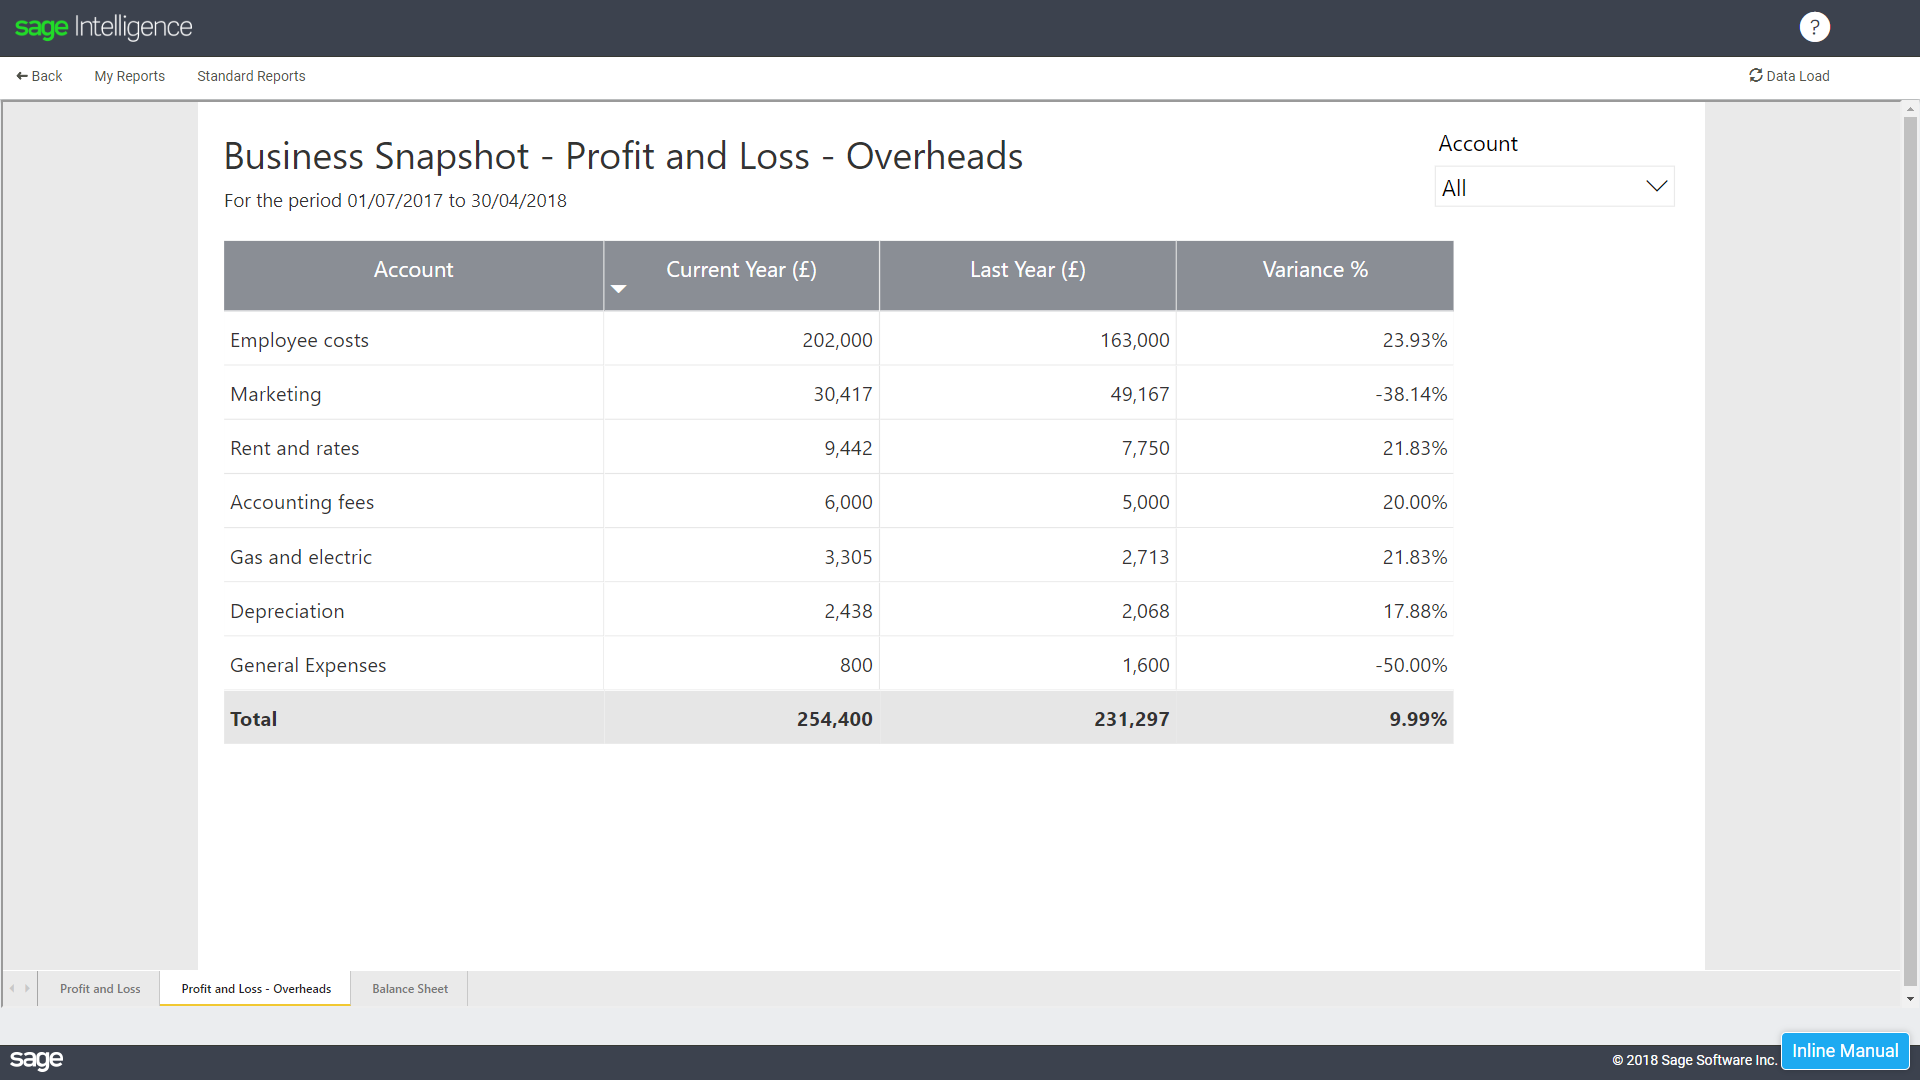
As a business owner, you may also want to see your Top 5 Expenses. From this Dashboard, you can click on the P&L Overheads tab and view a full list of your business expenses compared to last year, as well as the percentage variance.
Checking out the Balance Sheet tab
A balance sheet is a snapshot of what your business owns (assets) and owes (liabilities) at a specific point in time. Your balance sheet is an indicator of the financial health of your business.
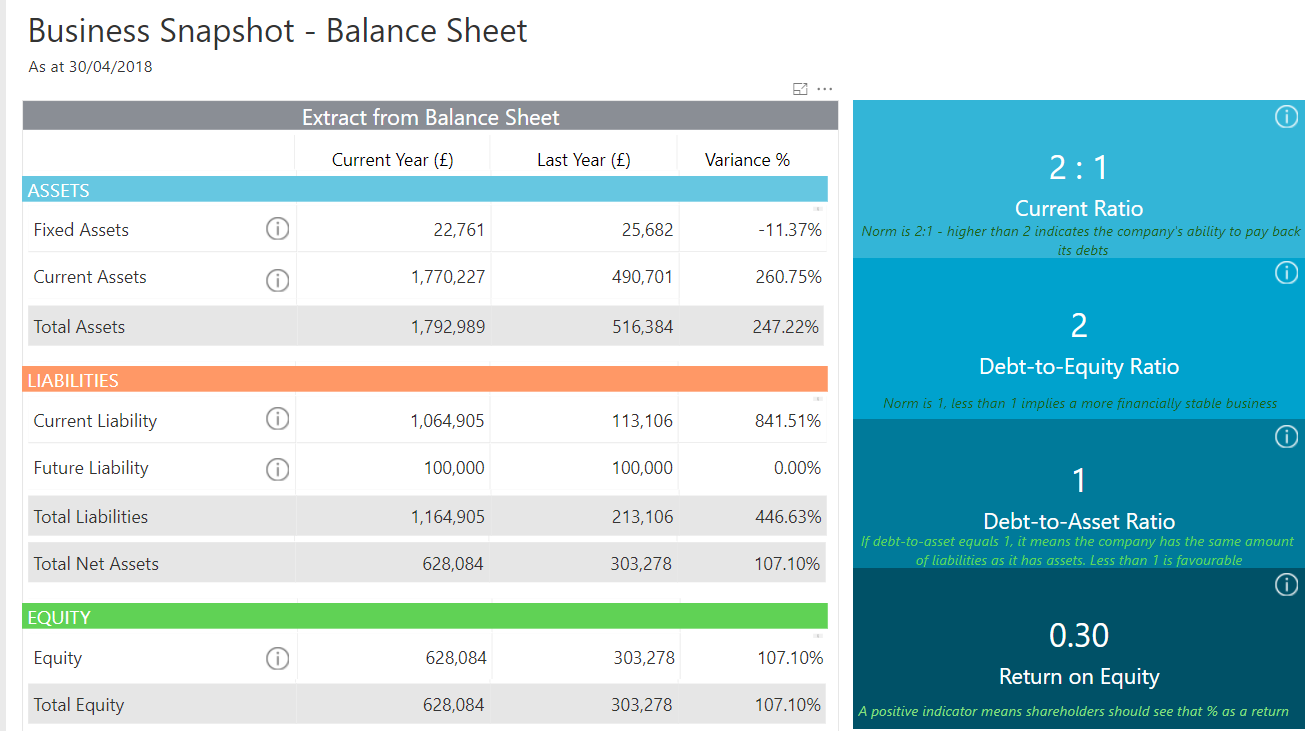
We have included specific ratios to help you determine your business’s health. While these may initially seem daunting, we have included a description of what each ratio means. You simply need to click (i) for a detailed explanation.
To learn more about this report and how to make best make use of it, watch this short learning video.
Get more insights into your information!
Did you know that we’ve introduced FIVE interactive dashboard reports just like this to Sage Intelligence for Accounting? Click on the report below that you want to find out more information on, and discover the incredible impact it will have on your business:
- Understand your customers with a Sales Trend Analysis report.
- Get a picture of your business’s health with the Financial Hygiene Dashboard.
- Collect your cash with the Analysis of Aged Debtors report.
- Track your creditors with the Analysis of Aged Creditors report.
- Know your numbers with the Business Snapshot Dashboard.
Check out how these interactive dashboards can change the way you see your business by logging in to your Sage Accounting solution and trying them out now!
