A dashboard is a business tool that displays a set of metrics, KPIs and other relevant information to a business user. Dashboards are here to stay because of their simplicity and self-service capabilities. And recently, Microsoft has made dashboards even more relevant, visual and efficient to use through Power BI. Haven’t heard of it? Here’s why you should join the hype.
A key benefit of making use of dashboards in your business is that it gives power to decision makers. This is because decision makers want to view and analyze information in visually pleasing ways without having to rely on their IT department or outside consultants to build custom reports.
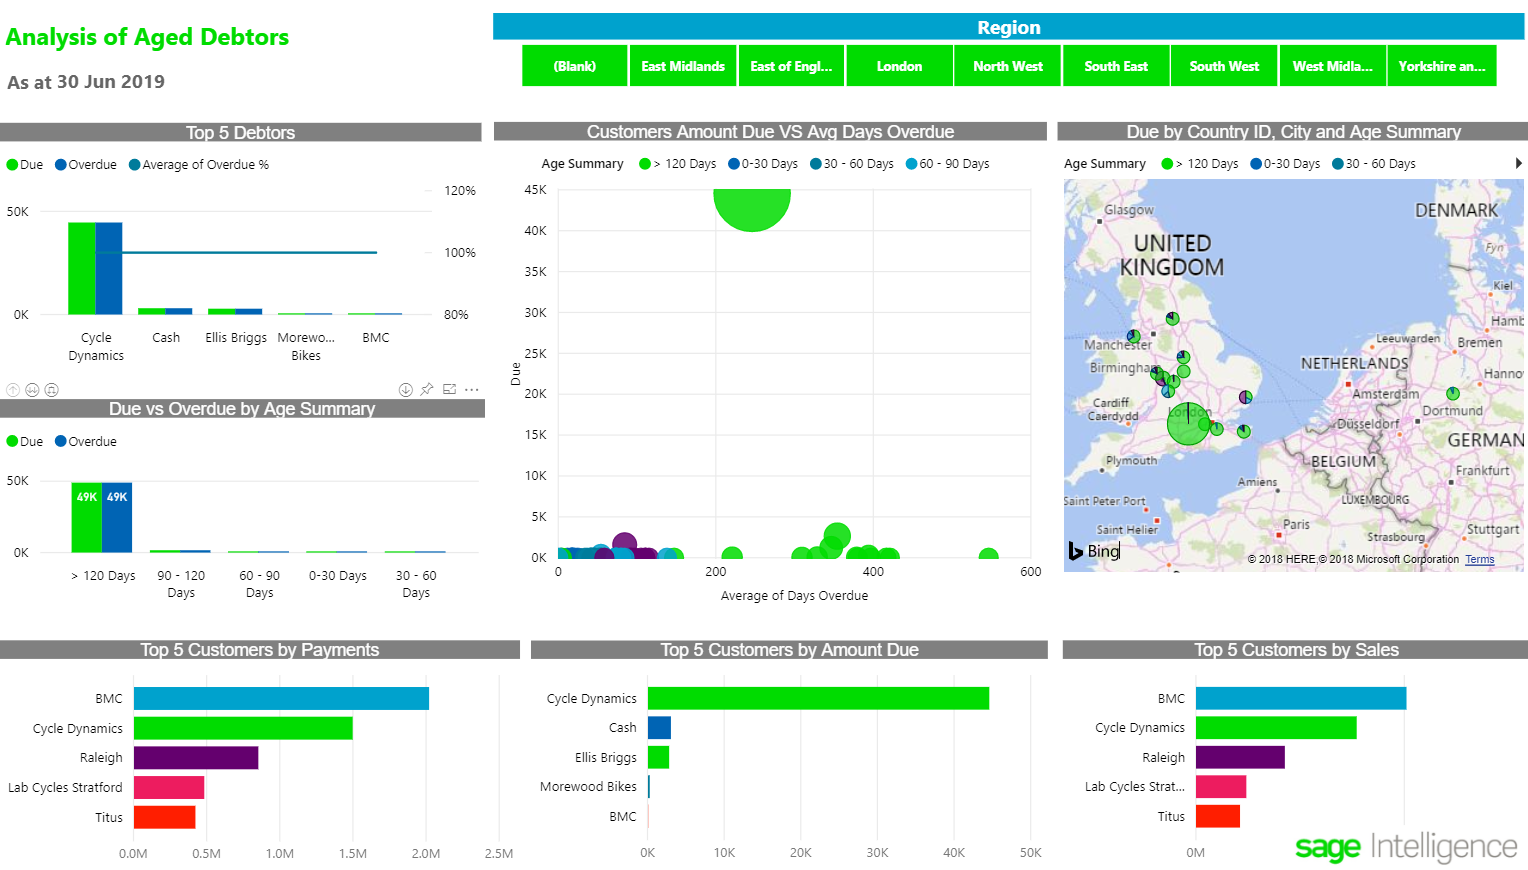
The data that’s displayed in the dashboard is typically generated in real time, retrieved automatically from data sources from across the business. In addition, effective dashboards are interactive. For example, an operations manager’s dashboard should provide the ability to drill into a particular aspect of production to get further details.
Dashboards provide an effective solution to the overwhelming amount of data that executives, operations managers and sales or service professionals experience every day. A dashboard can improve employee productivity—and save your company money—by providing easier, more intuitive access to project and accounting details. Consider the efficiency gains when compared to requiring workers to sift through paper and emails to compile information.
An effective dashboard:
- Presents information with clarity, speed and relevance.
- Offers personalization options so users can configure what data is important to them.
- Minimizes unnecessary distractions, which could cause confusion.
- Enables drill down to find more detail and context.
- Provides a design and structure that is pleasant and appealing to the eye.
A well designed dashboard puts emphasis on visuals and KPIs that communicate your data clearly. Distracting animations and glossy graphics tend to get in the way of content. By using a dashboard effectively, you’re able to monitor the business’s health and ensure that you’re always on track to meet targets, or adjust your objectives as necessary. If you’d like to delve a little deeper into discovering how to spot essential KPIs and ensure that you’re monitoring all the right vitals in your business, check out this e-book.
