You can easily represent your data from a PivotTable into a PivotChart. PivotCharts allow you to graphically represent your data which can help you to easily see comparisons, patterns and trends. For example, a Sales Manager can use PivotCharts to analyse the performance of his or her sales staff.
A PivotTable is an interactive table that summarises large amounts of data, which you can analyse even further using a PivotChart. Instead of creating a regular chart from scratch each time, you can create a single PivotChart and view different parts of your data by changing your PivotTable.
You can create a Pivot Chart from scratch or from an existing PivotTable. In this week’s tip we’ll show you how to create a PivotChart from scratch.
You are welcome to download the workbook to practice this exercise.
1. Select any cell within the data range.
2. Select the Insert tab then Pivot Chart. Then select OK

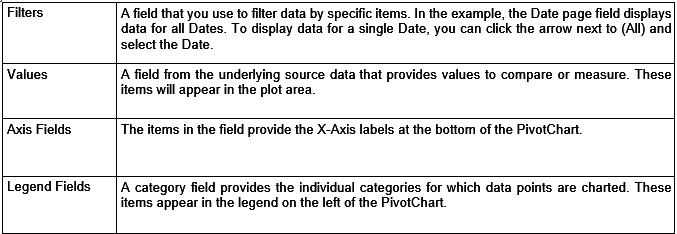
3. Drag and place the Sales Persons field into the axis field’s area (categories).
4. Drag and place the Product Sales fields into the values area.5. Add a title to the chart.
5. Add a title to the chart.
a. Select the chart.
b. Select the layout tab.
c. Select chart title.
d. Select above chart.
e. Enter the title, “Sales Report”.

f. The chart will be displayed as below.

As you can see, you have now created an interactive Pivot Chart, using the data in your PivotTable.
A Pivot Chart report always has an associated PivotTable report, both reports have fields that correspond to each other. When you change the position of a field in one report, the corresponding field in the other report also moves
