Sage Intelligence Reporting Cloud provides convenience to you as it lets you work in whichever environment you’re most comfortable in. You can either choose to design reports in your browser through the Online Report Designer or in Excel—through the Excel Report Designer. When making use of the Excel Report Designer, there are a number of points to take note of that will help you get the most out of your reporting. Below I provide eight of them.
Below I provide eight of them.
Applies to:
- Sage Intelligence for Accounting Reporting
- Sage 50cloud Intelligence
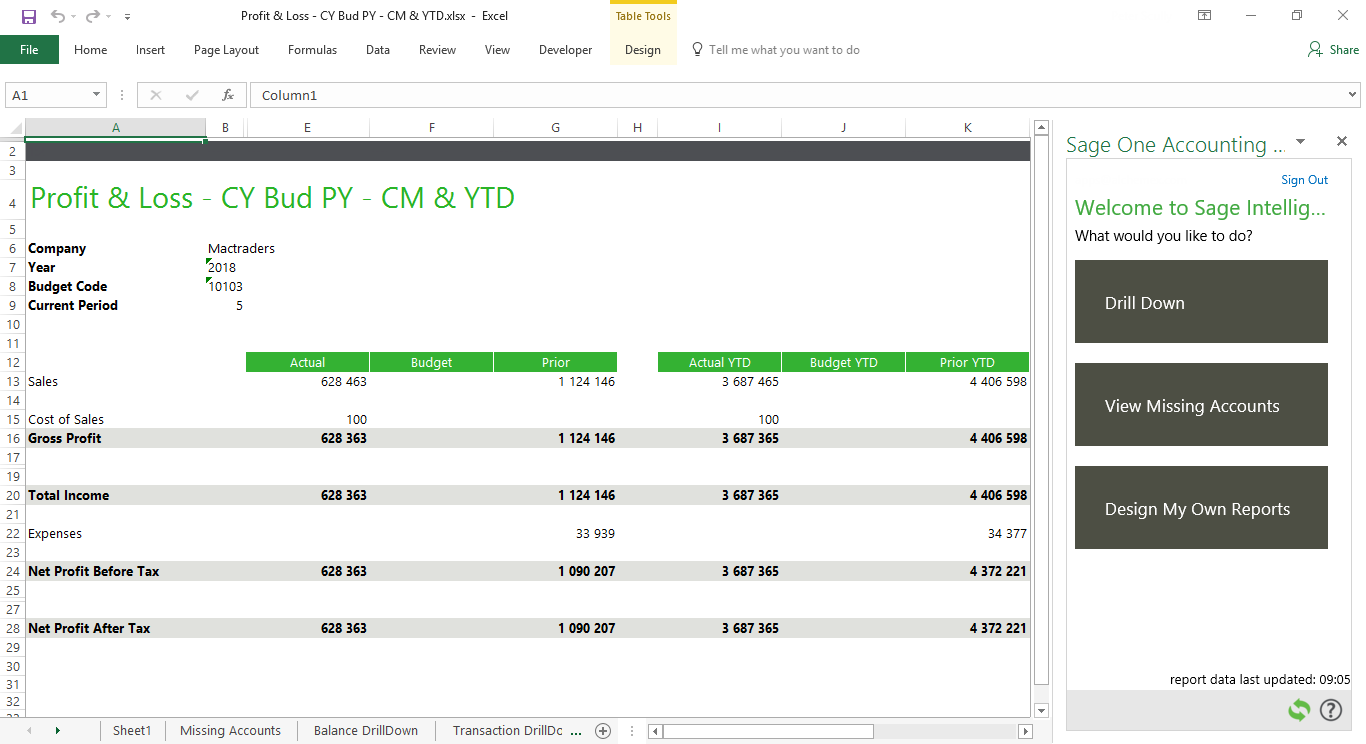
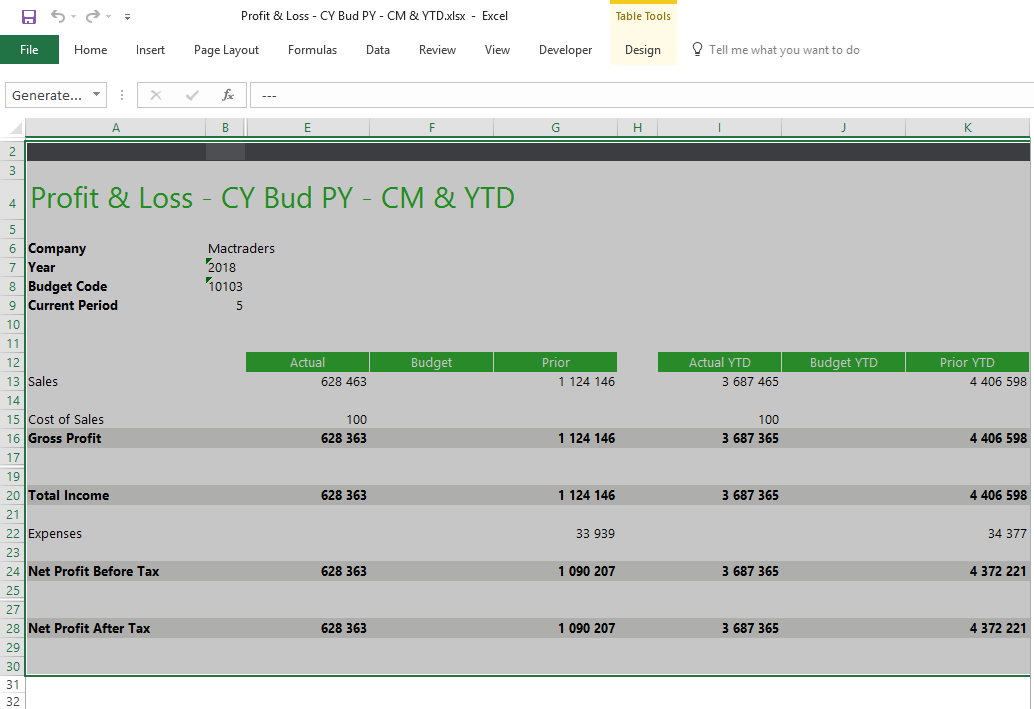
1. Work within the table when using the Excel Report Designer
When making changes to a layout involving Sage Intelligence functionality, make sure you work within the table area in the worksheet, as the Intelligence Reporting functionality is designed to work within an Excel table.
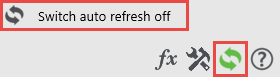
2. Turn Auto Refresh off before editing the Excel workbook
Turning off Auto Refresh before editing your reports will stop the table from refreshing when you are making changes on the worksheet. To do this, click on the Refresh icon at the bottom of the Excel Report Designer Task Pane and then select “Switch auto refresh off”.
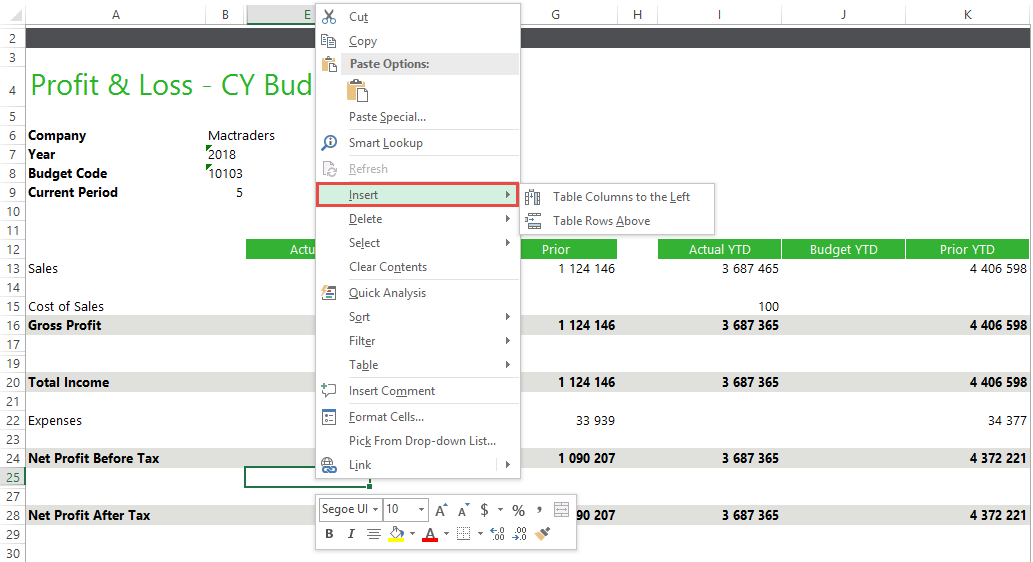
3. Inserting columns/rows into a table
When adding a new row to the layout, select a cell in the table area below where you want to insert the new row. Then right-click and from the context menu select Insert > Table Rows Above. Or if adding a new column to the layout, select a cell in the table area to the right of where you want to insert the new column. Then right-click and from the context menu select Insert > Table Columns to the Left.
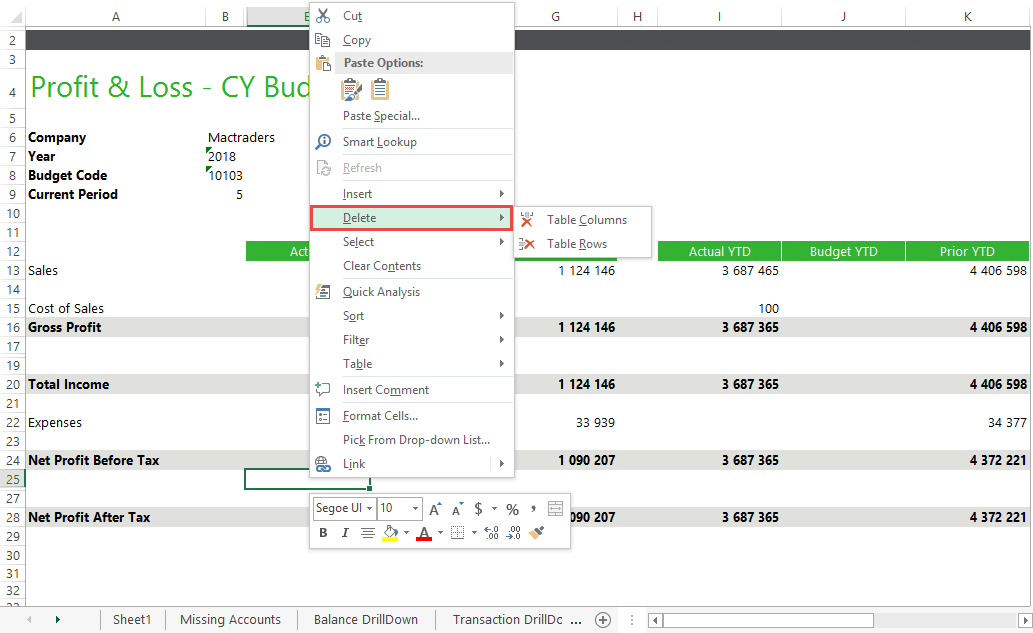
4. Deleting columns/rows
When deleting columns or rows make sure you use the Table Delete functions similar to the Insert functions above. To remove a column or row, select a cell in the table area of the row or column you want to remove. Then right-click and from the context menu select Delete and then either Table Columns or Table Rows.
5. Remove unneeded rows or columns from the table
The fewer cells you have in a layout the quicker it is for the table to refresh, so removing any unneeded ones will improve performance.
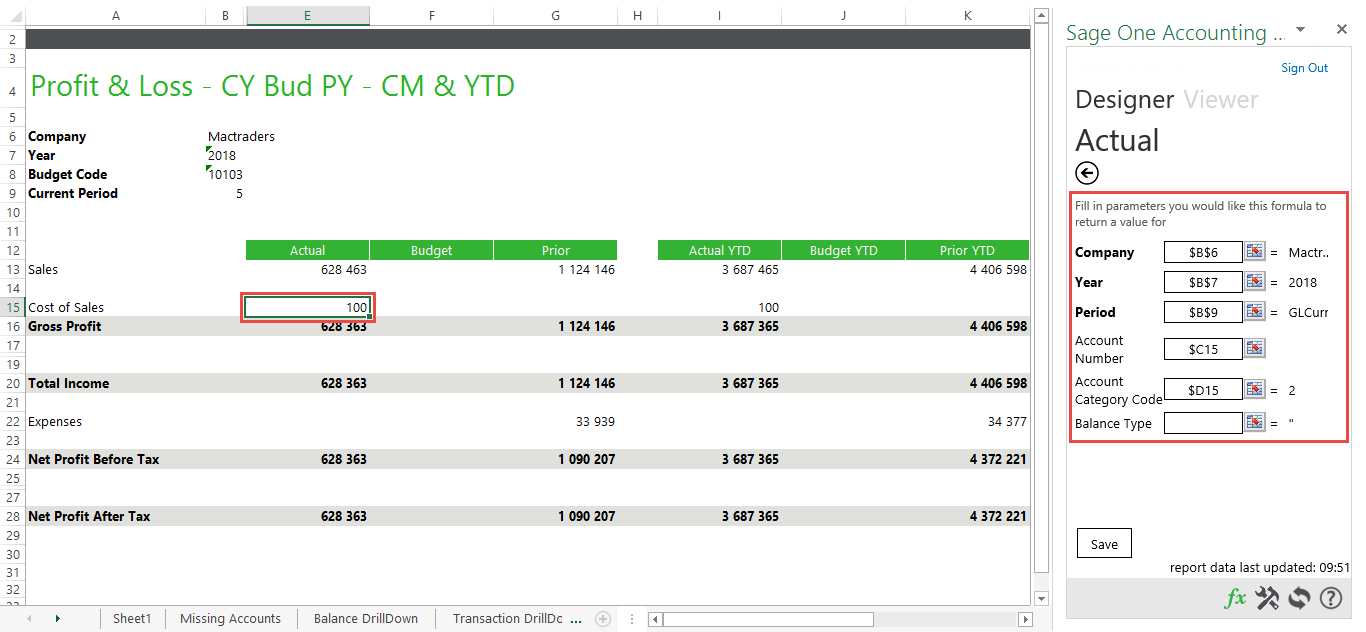
6. Absolute Referencing cells when using Sage Intelligence Formulas
When using Sage Intelligence formulas, it can be essential to use Absolute Referencing. This allows you to move or copy formulas around in a layout and still ensure that they maintain their cell referencing.
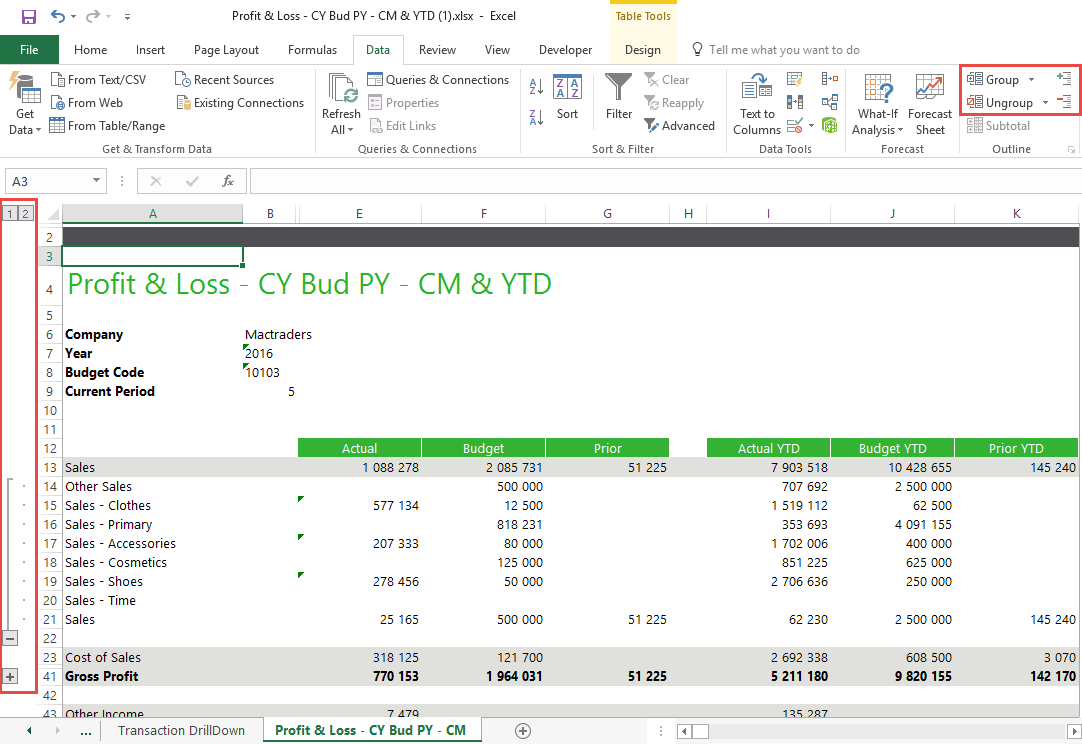
7. Use grouping to show or hide account level detail
If your layout includes account level detail, you can provide both a summary and detail level view by using Excel’s Grouping function.
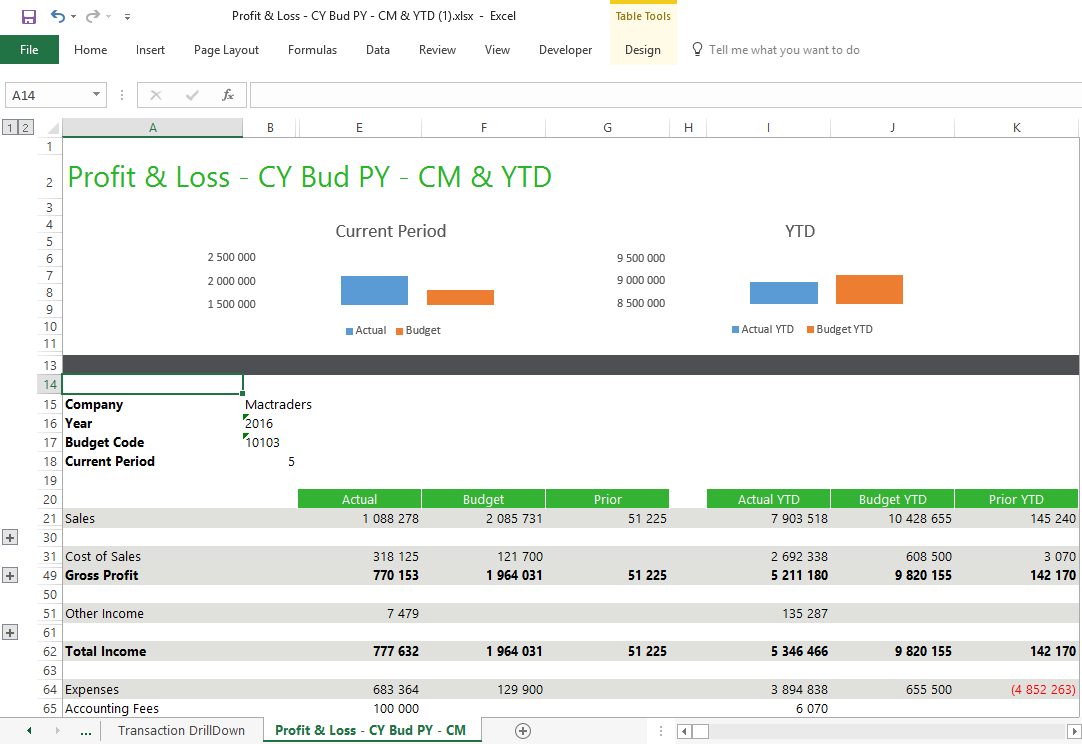
8. Adding Charts to the worksheet
When adding Charts to a layout that includes grouping, it’s advisable to place them above the table area or to the right of it above any grouped rows. You may need to insert additional worksheet rows above your table area for this. This will prevent the Charts from either moving out of view, or being stretched if placed to the right of the table area or below it when any grouped rows are expanded. If you would like more information on adding Charts then take a look here.
These tips will help you get the most out of the Excel Report Designer when using Sage Intelligence. Have you discovered any tips of your own that you’d like to share? Let us know in the comments below!
