The Bing Map app is a flashy Microsoft® Excel® Add-In app that makes it easy to plot locations and visualize your data in Excel. The Bing Map would be best to use with data where you have to display values for regions or countries.
In today’s exercise, we will use the example of a multinational company that will need to use the Bing Map to better visualize revenue and expenses for different countries or regions.
You are welcome to download the workbook to practice.
Applies To: Microsoft® Excel® 2013, 2016.
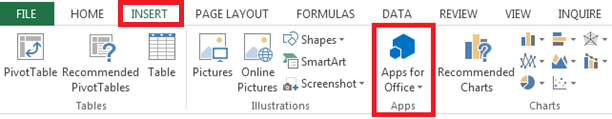
1. If you do not have the Bing Add-In installed, you can find it by clicking on the Apps for Office button.
2. Search for Bing then select and click on Trust IT.
3. If you have a Microsoft account and have signed in, you can install the app using the below steps:
- You will be asked to sign-in, if you have not done so already.
- In case you do not have a Microsoft account, then click on Sign In, enter you email address and click Next.
- Should the email not be registered, then sign up by clicking on Sign Up in the top right corner.
4. Highlight your entire data range within your Excel worksheet.
5. If the Bing Map is already installed, click on Apps for Office and select Bing Maps under my Apps.
6. A full size map will appear. Click the X to close the prompt.
7. Click on the Show Locations button on the top of the Bing Map to display the values on the map.
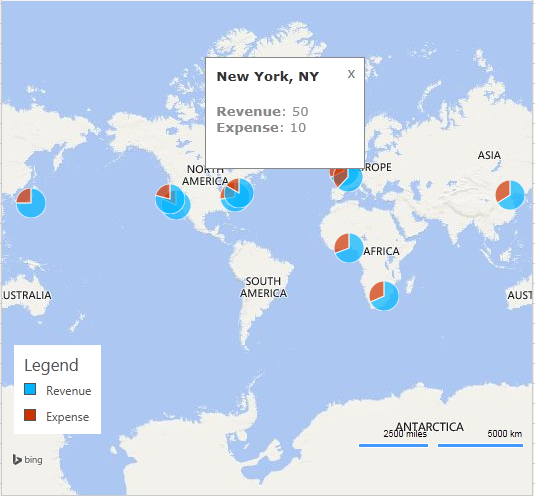
8. To view an amount, click on the bubble.

As you can see, it is easy to visualize data on a Bing Map. It can also be incorporated into a dashboard, giving you that extra edge in presenting your reports.
