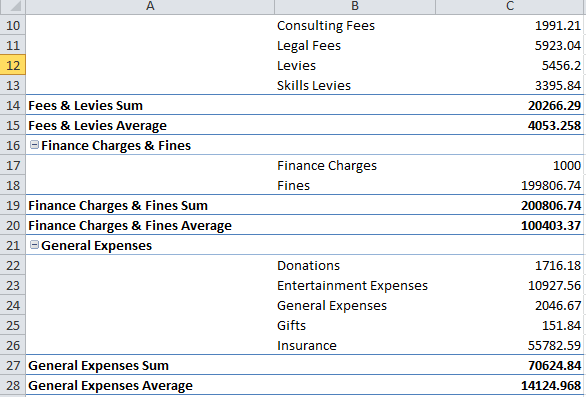
PivotTables are a very useful tool for business reporting especially when you have a lot of data to report on, that’s why they are our topic of focus lately. PivotTables help you quickly summarize, analyze, explore, and present large volumes of data. Did you know that you can summarize or analyze your data with more than one subtotal? An accountant friend of mine was thrilled when I showed him how to summarize expenses by using the sum and average functions. Below I share the same trick with you, I hope you’ll find it just as useful!
Note: Download the workbook to practice this exercise
Applies To: Microsoft® Excel® 2010 and 2013
- Open the example exercise workbook, where a PivotTable is set up.
- Right click on one of the categories within the PivotTable, for instance General Expenses.
- Select Field Settings from the list.
- Select Custom under Subtotals and Filters.
- From the functions list, select Sum and Average.
- Click OK.
The expenses will be analyzed by the Sum and Average functions. Thus you can see the total and average expenses under one subtotal.


