Whichever industry you work in, the chances are you have to report back in some form or another. Whether it’s a sales report, showing who reached their weekly/monthly targets, or something like what I have to do—marketing reports, showing feedback and progress on campaigns.
My role consists of managing and creating marketing campaigns, and so a huge focus for me is the return on investment (ROI), as I want to obviously gain the maximum out of my budget.
This obviously makes measuring campaigns important so that I can pick up what works and what doesn’t. With this data, I can make quick changes to my current campaigns and also refer to this for future campaigns.
Reports can take up a lot of my time and can be quite complex to make sense of, as they can contain a lot of information which might only be applicable to a monthly report. But what if I need to report back to my manager and team on a weekly basis? I would need to see certain things in my report quickly and easily. I also need the viewer of my report to understand my report at a glance.
At Sage, I attended an Excel course (Excel On Steroids) developed and managed by Sage Intelligence, which is where I discovered PivotTables and PivotCharts! This simplified my life so much that I can receive my reports from an internal or external team member and convert this data to a PivotTable, and then a PivotChart. I then incorporate slicers which filter your pivot data even further, making it easy for you or the viewer of your report to find exactly what you are looking for.
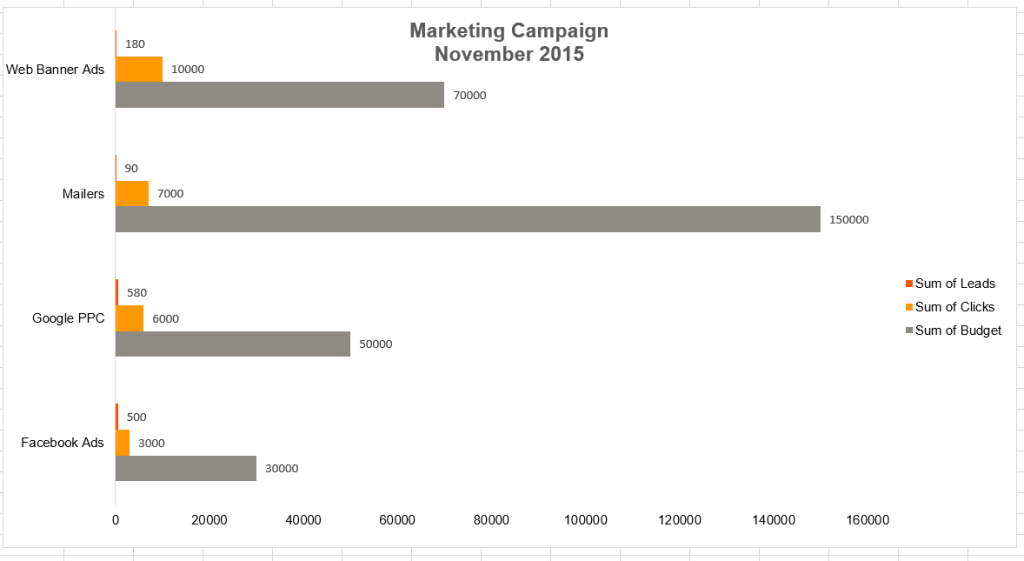
PivotTables and PivotCharts provide my data in a summarized format, making my reporting process easy. This gives me time to analyze the data and pick up patterns and trends on what is working well, and what is not working at all. I can then send this to my manager or team who can quickly see what is important for them.
Did I mention that it is also visually appealing? It makes your data look interesting, and by use of color and formatting, you can turn a report that your manager usually dreads to receive, into something exciting that they can now share without having to edit much.

If you wish to get started and explore the endless possibilities of PivotTables and PivotCharts, you can start by subscribing to our weekly Excel Tips and Tricks newsletters or downloading this handy ebook offering some easy tips absolutely free, to get you started and well on your way to creating amazing reports.
You can also visit the Excel On Steroids website for more information on our classroom training courses (for South Africa only). Remember, with Excel the possibilities are endless.
