Microsoft Excel offers you the ability to create and design a Hierarchy SmartArt Graphic. This is useful in showing a graphical representation of an organogram, organisation chart or any hierarchy structure.
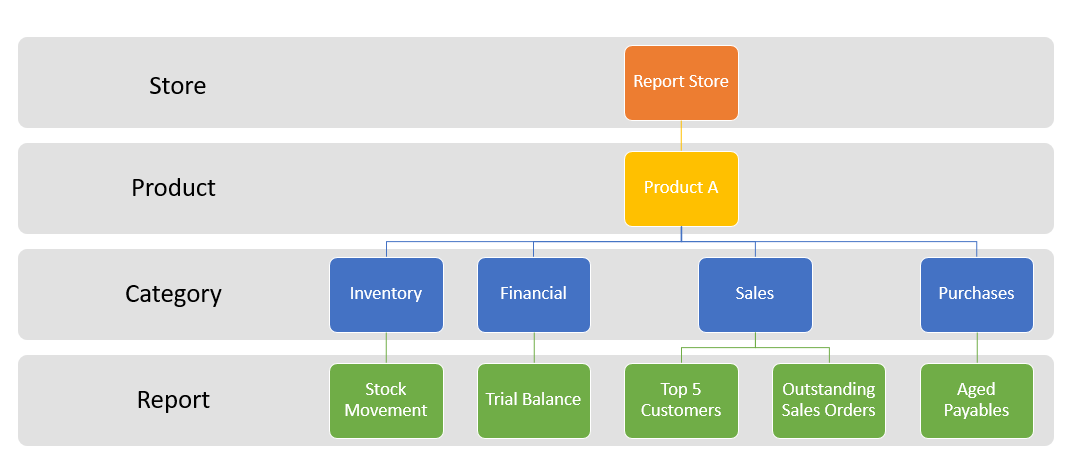
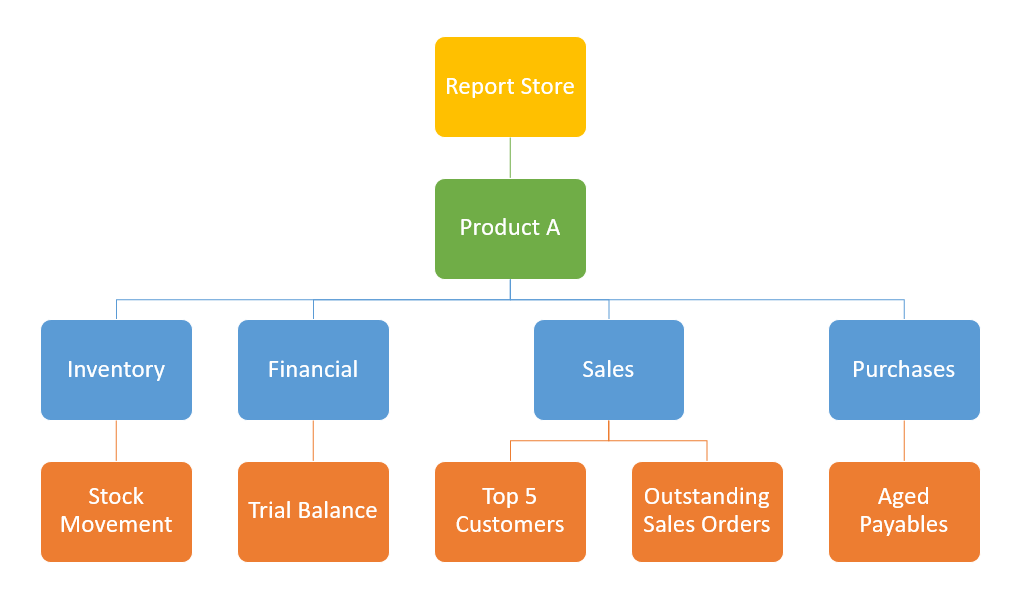
This example, explained below, will help you create your own hierarchy. Our example scenario is of a Report Store that contains reports created for different products that are organised by category.
The steps to create a hierarchy are as follows:
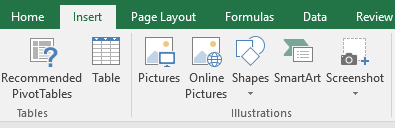
1. Using the Excel ribbon, select the Insert tab.
2. Click on Smart Art.
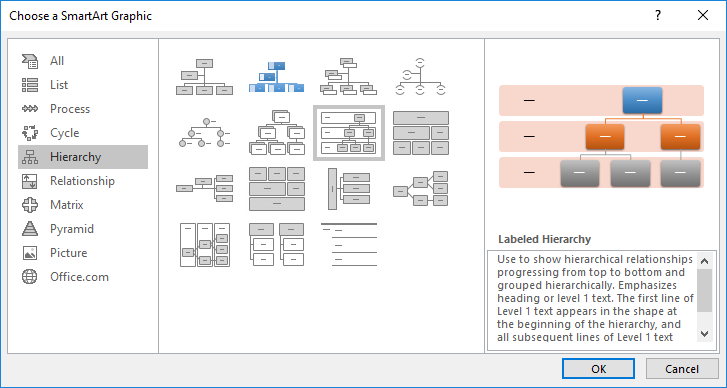
3. A Choose a SmartArt Graphic window appears from which a range of different graphics are available.
4. Click on Hierarchy (from the pane on the left) and choose Labeled Hierarchy from the list of icons.
5. Enter the details of each SmartArt Graphic (block), you can edit the text in the following ways:
- Right click the SmartArt Graphic and choose Edit Text, or
- Type it in on the window to the left of the graphic (window title is Type your text here).
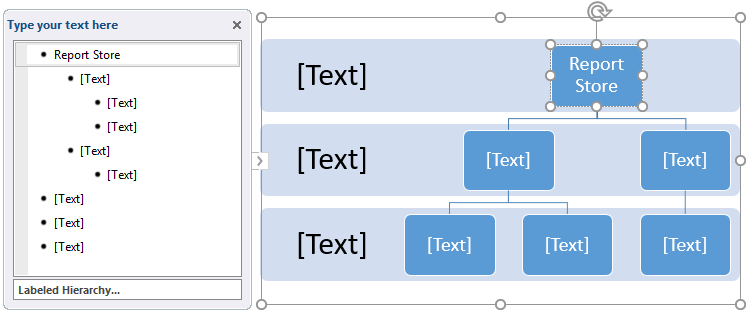
6. To add a SmartArt Graphic on the same level, right click the SmartArt Graphic, choose Add Shape and click either Add Shape After or Add Shape Before.
7. To add a SmartArt Graphic on the neighbouring level, right click the SmartArt Graphic, choose either Add Shape Above or Add Shape Below.
8. To change the labels to each level (on the left), either enter this by right clicking on the text [Text1] and choose Edit Text or type it in on the window to the left of the graphic.
9. The design and colours of the hierarchy can be customized using the options on the Design Tab.
10. The screenshot below shows the SmartArt Graphic with Labels.
11. The screenshot below shows the SmartArt Graphic without Labels.
This handy feature is also available in other Microsoft products e.g. Word, PowerPoint
