As a small business owner, getting a handle on your business’s financials doesn’t mean you have to be an accountant. However, you do need to know what the numbers mean and where they come from. Understanding your business financials is critical to your business success, which is why we’ve made it easier for you to gauge what’s going on in your business with a new financial dashboard in Sage Intelligence for Accounting.

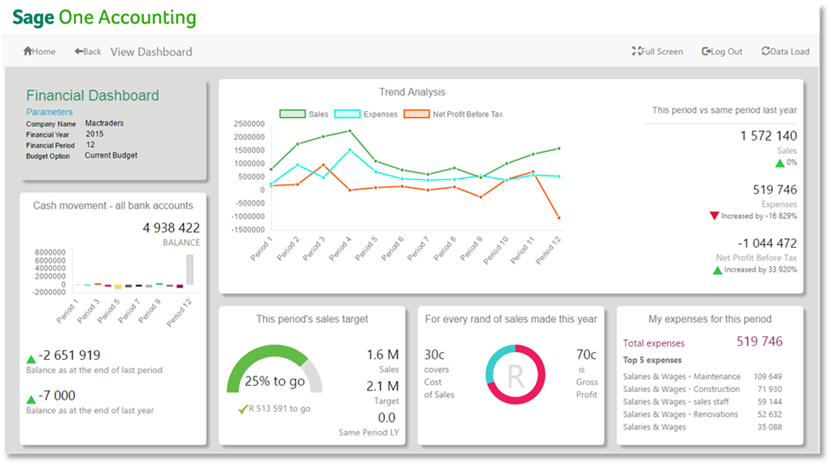
The financial dashboard will help you understand how your business is doing, and in some instances, compares it to the previous financial year. For example, you can see how much of your costs every Rand of sales covers, and how much of it is profit. Simplifying your financial information to this level gives you clear insight into your business and accelerates relevant decisions and activity.
You can also see the relationship between your sales, expenses and net profit before tax with the Trend Analysis. In addition, you can also gauge how far or close you are from reaching your target with the sales target graph. With this information at your fingertips, you will know whether you need to hustle harder or take it easy.
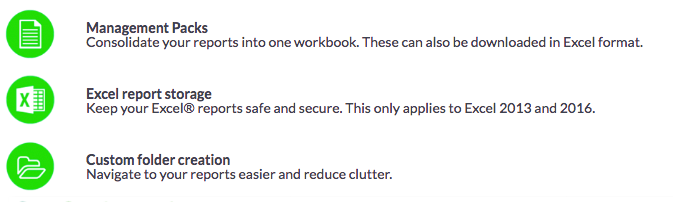
We haven’t only provided a dashboard for you. There are three other new features in Sage Intelligence that will come in handy:
To see these features in action, go ahead and give them a try. And, to learn how to make the most of them, register for an upcoming Sage Intelligence webcast.
